The bar graph given below shows the interest of boys and girls in different activities
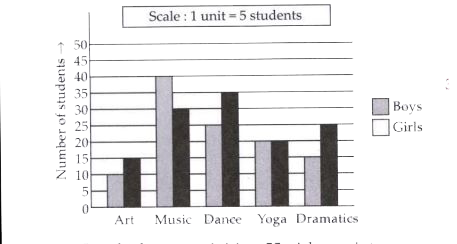
In which two activities, 55 girls are interested together ?
Art and music
Music and dance
Dance and yoga
Yoga and dramatics
Step by step video & image solution for The bar graph given below shows the interest of boys and girls in different activities In which two activities, 55 girls are interested together ? by Maths experts to help you in doubts & scoring excellent marks in Class 7 exams.
Updated on:21/07/2023Topper's Solved these Questions
- DATA HANDLINGBOOK - MTG IIT JEE FOUNDATIONCHAPTER - DATA HANDLINGEXERCISE - Exercise (Level - 2) M.C.Q
15 Videos
- DATA HANDLINGBOOK - MTG IIT JEE FOUNDATIONCHAPTER - DATA HANDLINGEXERCISE - Exercise (Level - 2) Match the Following
2 Videos
- DATA HANDLINGBOOK - MTG IIT JEE FOUNDATIONCHAPTER - DATA HANDLINGEXERCISE - NCERT Section (Exercise - 3 .4 )
8 Videos
- CONGRUENCE OF TRIANGLES BOOK - MTG IIT JEE FOUNDATIONCHAPTER - CONGRUENCE OF TRIANGLES EXERCISE - Olympiad/HOTS Corner
10 Videos
- EXPONENTS AND POWERSBOOK - MTG IIT JEE FOUNDATIONCHAPTER - EXPONENTS AND POWERSEXERCISE - OLYMPIAD/HOTS CORNER
15 Videos
Similar Questions
The bar graph given below shows the interest of boys and girls in different activities
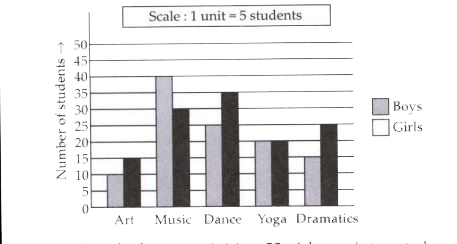
How many less boys are interested in yoga, dance and art altogether than girls
View SolutionDirection: Read the following table carefully and answer the questions given below: The given table shows the number of boys and girls in 5 different school:
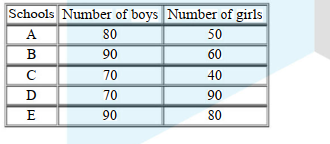
Find the ratio between the average number of girls in school B and D together and the average number of boys in school B and C together.
View Solution
Knowledge Check
Direction: Study the graph and answer the following question.
The graph shows the total number of boys and girls in different classes of a school.
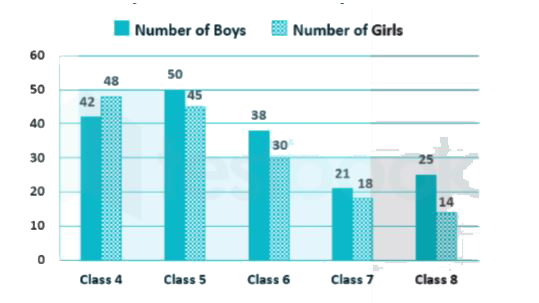
What is the total number of boys in these 5 classes together?A196B148C176D166the given bar graph represents the number of boys and girls in five different schools. Read the graph and answer the question that follows.
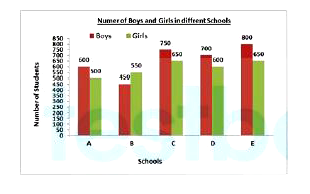
What is the ratio of the grils from schools A, B and C taken together to the boys from all schools taken together ?A59:66B33:17C66:59D17:33The given bar graph represents the number of boys and girls in five different schools. Read the graph and answer the question that follows.
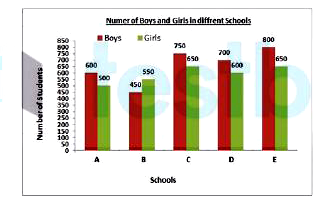
What is the average number of students (girls and boys) in schools A, B, C, D and E ?A596B1250C625D660
Direction: Read the following table carefully and answer the questions given below: The given table shows the number of boys and girls in 5 different school:
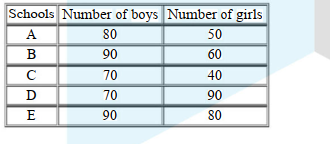
Find the total number of girls in school C and E together is how much percent more or less than the total number of students in school D
View SolutionIn the given bar graph what is the ratio of the total boys and girls in all schools
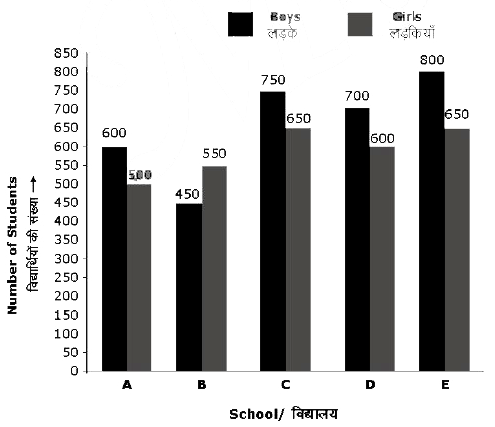
View SolutionIn the given bar graph, what is the ratio of the total boys and girls in all 5 colleges.
View SolutionDirection: Read the following table carefully and answer the questions given below: The given table shows the number of boys and girls in 5 different school:
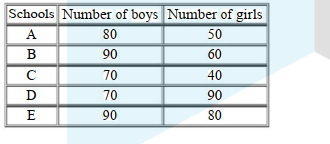
Find the average number of girls in schools B,C, and E
View SolutionThe table below shows the percentage of studying and the ratio of boys and girls in different colleges.Total students=1800.
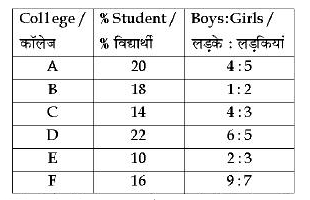
What is the percentage of girls in colleges D , E and F taken together.
View Solution
