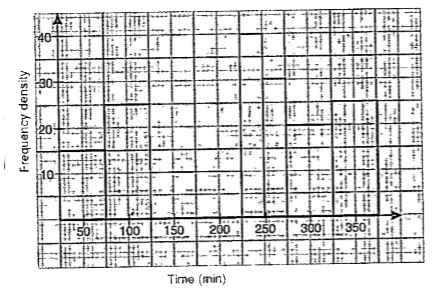
The diagram shows the histogram of the amount of time spent watching TV in a day for a group of students. Remember that the area of each rectangle is proportional to its frequency. Find the total number of students. (Take the most common base of the rectangles as 1 unit)
165
140
130
110
The correct Answer is:B
Topper's Solved these Questions
- DATA HANDLING BOOK - S CHAND IIT JEE FOUNDATIONCHAPTER - DATA HANDLING EXERCISE - Self Assessment Sheet - 27
10 Videos
- COMPOUND INTEREST BOOK - S CHAND IIT JEE FOUNDATIONCHAPTER - COMPOUND INTEREST EXERCISE - Self Assessment Sheet - 19
10 Videos
- DISTANCE, TIME AND SPEED BOOK - S CHAND IIT JEE FOUNDATIONCHAPTER - DISTANCE, TIME AND SPEED EXERCISE - Unit Test-3
20 Videos
Similar Questions
Write the following using numbers, literals and signs of basic operations State what each letter represents: The diameter of a circle is twice its radius. The area of a rectangle is the product of its length and breadth. The selling price equals the sum of the cost price and the profit. The total amount equals the sum of the principal and the interest. The perimeter of a rectangle is two times the sum of its length and breadth. The perimeter of a square is four times its side.
View SolutionWrite the following using numbers, literals and signs of basic operations State what each letter represents: The diameter of a circle is twice its radius. The area of a rectangle is the product of its length and breadth. The selling price equals the sum of the cost price and the profit. The total amount equals the sum of the principal and the interest. The perimeter of a rectangle is two times the sum of its length and breadth. The perimeter of a square is four times its side.
View Solution
Knowledge Check
Simplify:- 1/8 of 2/3 of 3/5 of 1715 = ?
Aa. 80Bb. 85Cc. 90Dd. 95Consider the following statements in respect of a histogram:
1. The total area of the rectangles in a histogram is equal to the total area bounded by the corresponding frequnecy polygon and the x-axis.
2. When class intervals are unequal in a frequency distribution, the area of the rectangle is proportional to the frequency.
Which of the above statements is/are correct?A1 onlyB2 onlyCBoth 1 and 2DNeither 1 nor 218 men and 36 women can level an area of 810 sq. in 6 days. The ratio of the areas that each man and each woman can level in the same amount of time is 3:1. Find the number of dayss is which 22 men adn 14 women can level an area of 120 sq. m.
A8B12C9D10
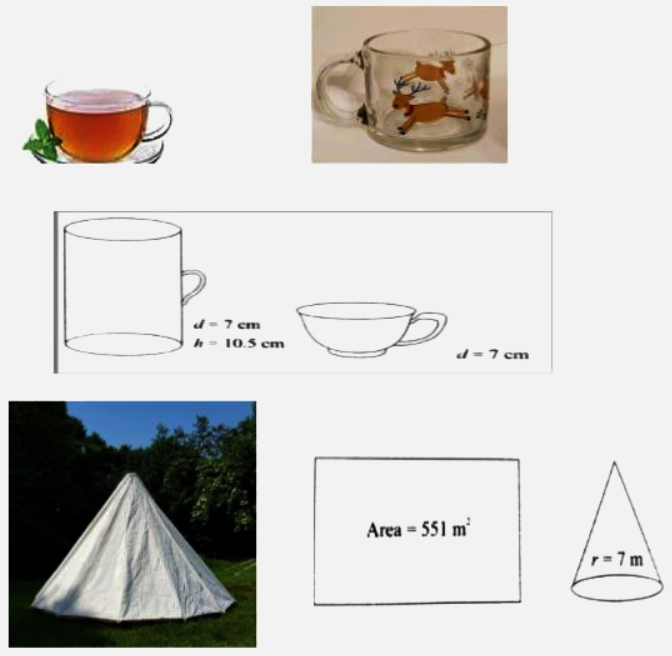
Adventure camps are the perfect place for the children to practice decision making for themselves without parents and teachers guiding their every move. Some students of a school reached for adventure at Sakleshpur. At the camp, the waiters served some students with a welcome drink in a cylindrical glass and some students in a hemispherical cup whose dimensions are shown below. After that they went for a jungle trek. The jungle trek was enjoyable but tiring. As dusk fell, it was time to take shelter. Each group of four students was given a canvas of area 551m2. Each group had to make a conical tent to accommodate all the four students. Assuming that all the stitching and wasting incurred while cutting, would amount to 1m2, the students put the tents. The radius of the tent is 7m.

How much space on the ground is occupied by each student in the conical tent.
View SolutionAdventure camps are the perfect place for the children to practice decision making for themselves without parents and teachers guiding their every move. Some students of a school reached for adventure at Sakleshpur. At the camp, the waiters served some students with a welcome drink in a cylindrical glass and some students in a hemispherical cup whose dimensions are shown below. After that they went for a jungle trek. The jungle trek was enjoyable but tiring. As dusk fell, it was time to take shelter. Each group of four students was given a canvas of area 551m2. Each group had to make a conical tent to accommodate all the four students. Assuming that all the stitching and wasting incurred while cutting, would amount to 1m2, the students put the tents. The radius of the tent is 7m.

The height of the conical tent prepared to accommodate four students is
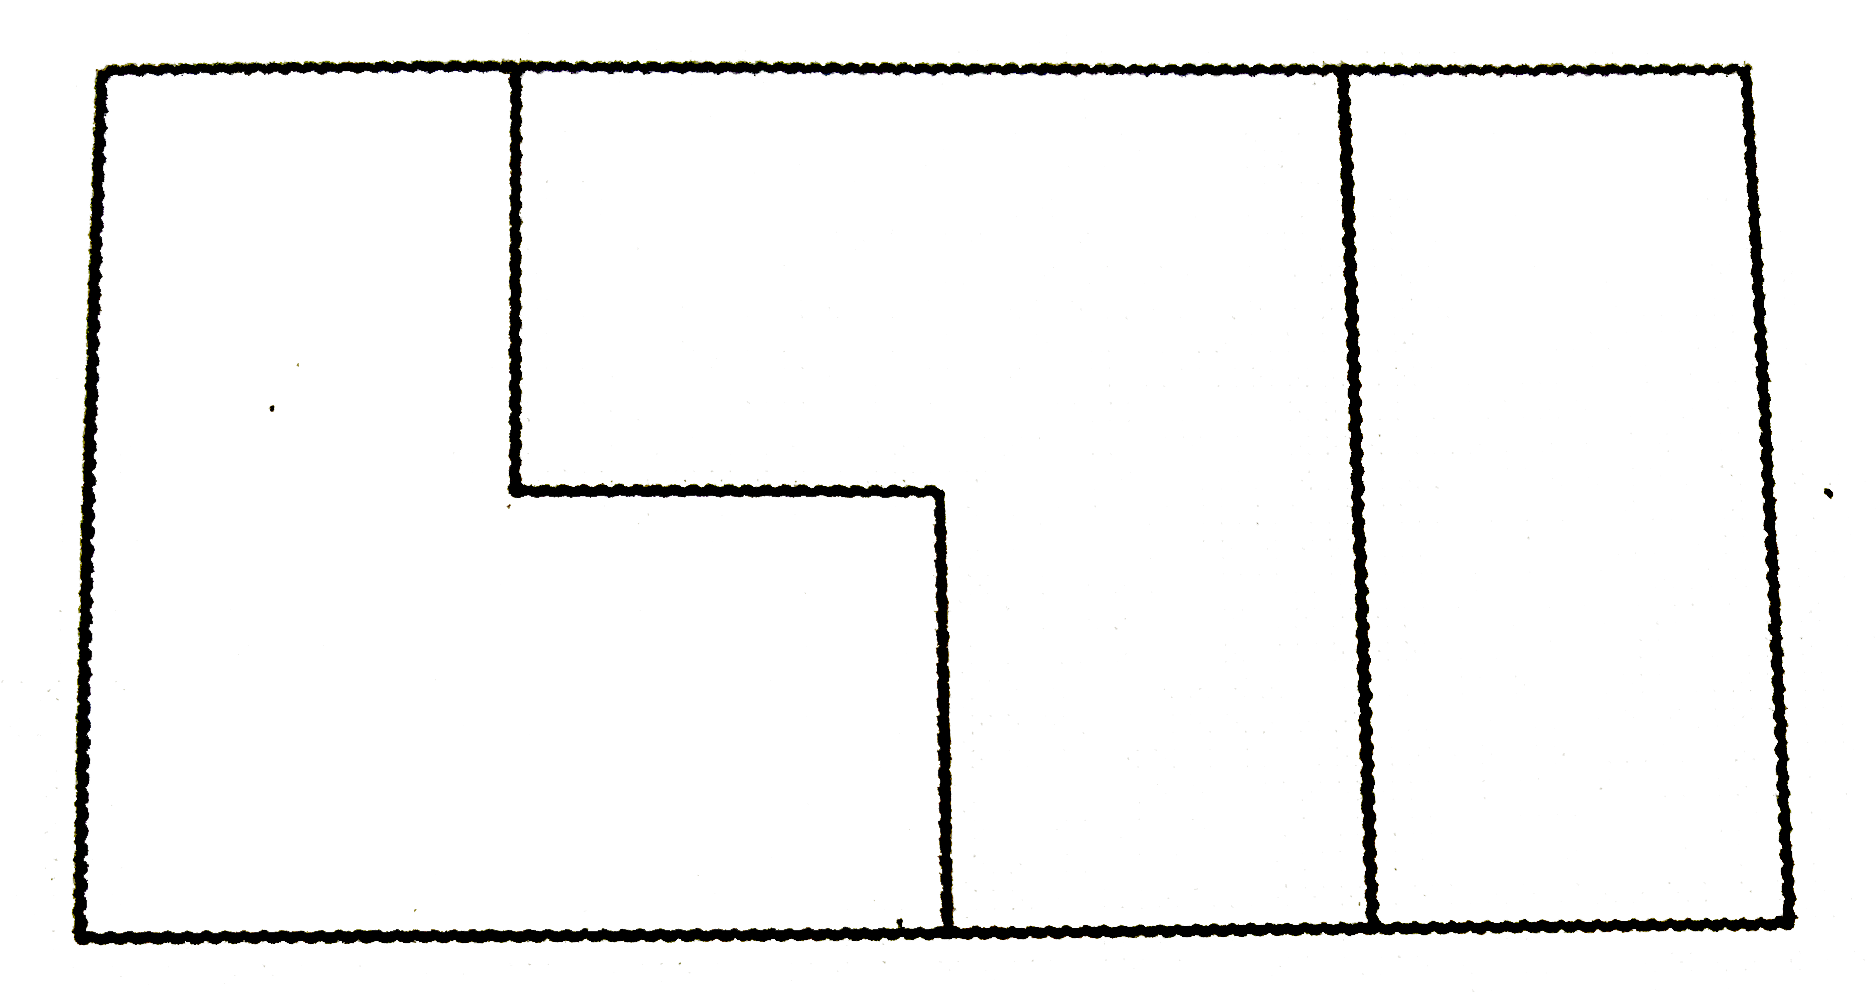
View SolutionIt was time for celebrations in the Gryffindor common room. But as luck would have had it, Seamus miscued a spell setting the common room floor on fire. The students were evacuated quickly. Dumbledore was informed of this act and he thought of the perfect punishment for Seamus. He had to tile the common room without using magic (of course). The room was two units wide and N units long. Seamus was provided with two types of tiles: a rectangle that is one unit wide and two units long, and a L-shaped tile covering 3 square units. Pictures of the tiles are shown below. Seamus was allowed to rotate the tiles as he laid them. He had an unlimited supply of tiles. He however failed, and requested Harry to help. Harry said that he could only tell the number of different ways of tiling the room using these tiles. For instant, a2×3 room could be tiled in 5 different ways as follows:

Notice that the tiling could use both types of tiles. consider the tiling of a2×4 room below.

Seamus then asks Harry for the number of different ways of tiling a room of dimension 2×12. What would be Harry's answer?
View SolutionFind the number of subsets of A×B, if n(A)=2 and n(B)=4
The following are the steps involved in solving the above problem. Arrange them in sequential order (A) The number of elemetns in A×B is 4×2=8.
(B) The number of subsets of a set with n elements =2n
(C) Given n(A)=2 and n(B)=4.
(D) ∴ Required number of subsets is 28=256.
View SolutionSuman was doing a project on a school survey, on the average number of hours spent on study by students selected at random. At the end of survey, Suman prepared the following report related to the data.
Let X denotes the average number of hours spent on study by students. The probability that X and can take the values x, has the following form, where k is some unknown constant.
P(X=x)=⎧⎪ ⎪ ⎪ ⎪⎨⎪ ⎪ ⎪ ⎪⎩0.2, if x = 0kx, if x = 1 or 2k (6-x), if x = 3 or 40, otherwise

Based on the above information, answer the following questions.
What is the probability that the average study time of students is at least 1 hour ?
View Solution
