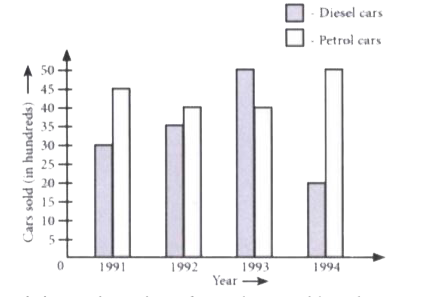
Study the graph carefully and answer the following questions.
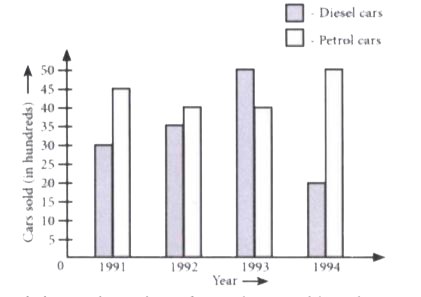
Find the mean sale of Petrol cars.
A
4735
B
5745
C
5740
D
4375
Text Solution
The correct Answer is:D
|
Topper's Solved these Questions
Similar Questions
Knowledge Check
Study the graph carefully and answer the following questions.
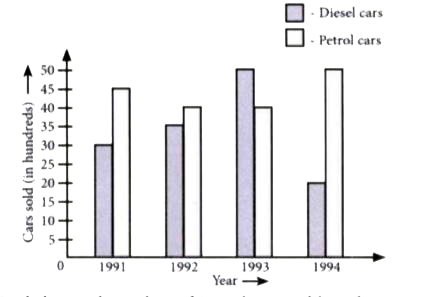
Find the total number of Diesel cars sold in the year 1992 and 1994 together.A2500B5500C1500D4500Study the graph carefully and answer the following questions.
How many more Diesel cars were sold in 1991 than in 1994?A500B1500C1000D2000Study the graph carefully and answer the following questions.
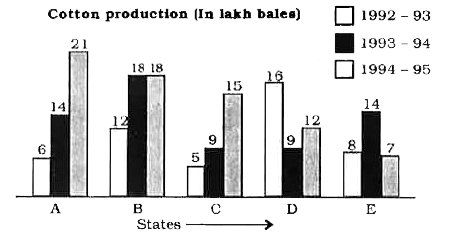
Which of the following statement is false ?AState A and E showed the same production in 1993-94.BThere was no improvement in the production of cotton in state B during 1994-95.CState A has produced maximum cotton during the given period.DProduction of state C and D together is equal to that of state B dring 1993-94.
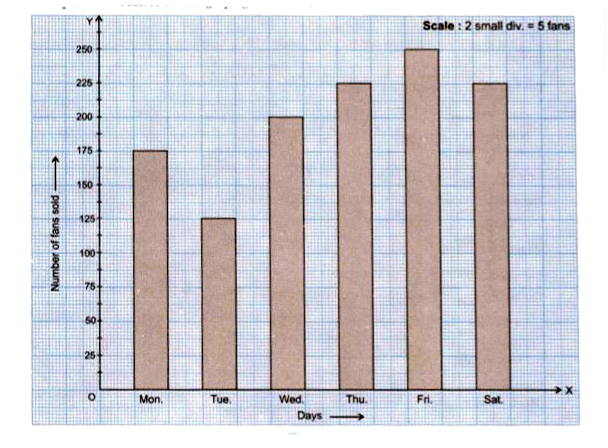
Observe the bar graph given below :
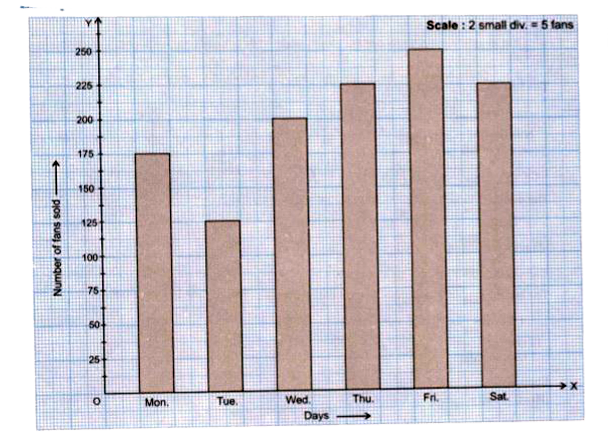
Read the bar graph carefully and answer the following questions :
On which day of the week was the sale maximum?
View SolutionStudy the graph carefully and answer the following questions.
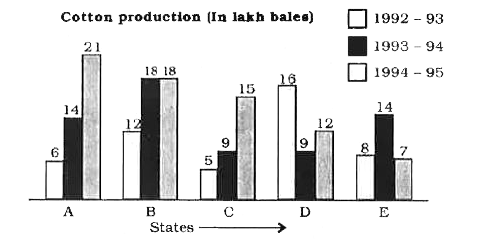
What is the average production of the four states in the year 1994-95 taken together ?
View SolutionStudy the graph carefully and answer the following questions.
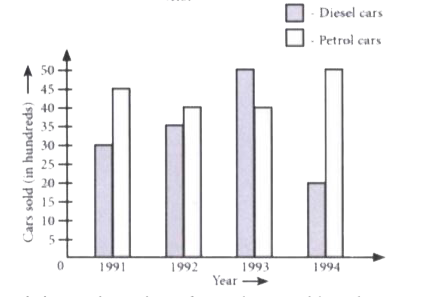
How many cars were sold during the year 1991?
View Solution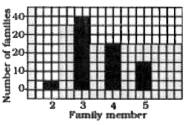
Study the bar graph carefully and answer the following question.
Which type if family is the most common ?
View SolutionStudy the following graph carefully and answer the following questions -----
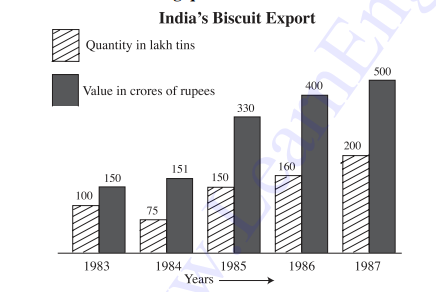
What was the difference between the tins exported in 1985 and 1986 ?
View Solution

