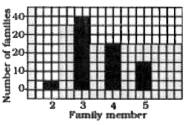
Study the bar graph carefully and answer the following question.
Which type if family is the most common ?
2 members
3 members
4 members
5 members
The correct Answer is:B
Step by step video, text & image solution for Study the bar graph carefully and answer the following question. Which type if family is the most common ? by Maths experts to help you in doubts & scoring excellent marks in Class 14 exams.
Topper's Solved these Questions
- BOOK - KIRAN PUBLICATIONCHAPTER - STATISTICS AND DATA INTERPRETATIONEXERCISE - TYPE-III39videos
STATISTICS AND DATA INTERPRETATION
- BOOK - KIRAN PUBLICATIONCHAPTER - STATISTICS AND DATA INTERPRETATIONEXERCISE - TYPE-IV182videos
STATISTICS AND DATA INTERPRETATION
- BOOK - KIRAN PUBLICATIONCHAPTER - STATISTICS AND DATA INTERPRETATIONEXERCISE - TYPE-VIII8videos
STATISTICS AND DATA INTERPRETATION
- BOOK - KIRAN PUBLICATIONCHAPTER - SIMPLIFICATIONEXERCISE - TEST YOURSELF25videos
SIMPLIFICATION
- BOOK - KIRAN PUBLICATIONCHAPTER - TIME AND DISTANCEEXERCISE - Type -XI74videos
TIME AND DISTANCE
Similar Questions
Knowledge Check
- Question 1 - Select One
Study the graph carefully and answer the following questions.
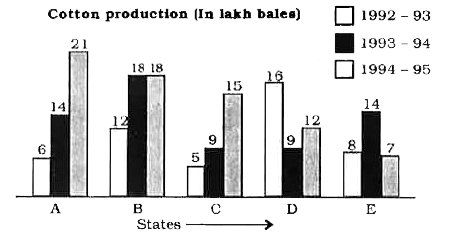
Which of the following statement is false ?AState A and E showed the same production in 1993-94.BThere was no improvement in the production of cotton in state B during 1994-95.CState A has produced maximum cotton during the given period.DProduction of state C and D together is equal to that of state B dring 1993-94. - Question 2 - Select One
Study the graph carefully and answer the following questions.
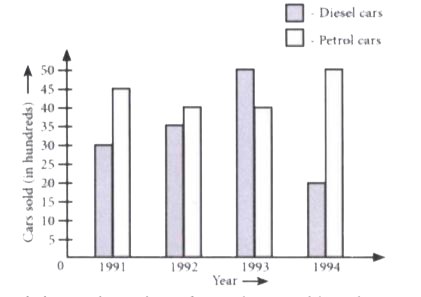
Find the mean sale of Petrol cars.A4735B5745C5740D4375 - Question 3 - Select One
Study the following graph carefully and answer the following questions -----
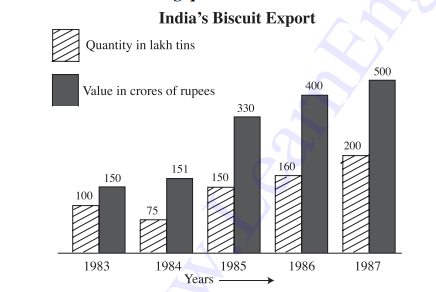
In which year the value per tins was minimum ?A1983B1984C1985D1986
Study the given graph carefully and answer the following questions.
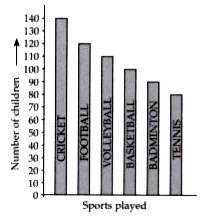
What fraction of the total number of children plays football ?View SolutionRead the bar graph carefully and answer the following questions.
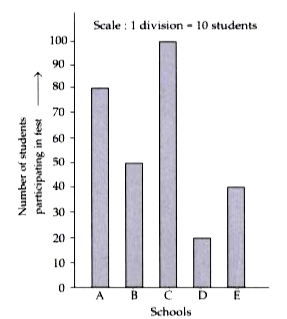 From which school maximum number of students participated ?View Solution
Study the following graph carefully and answer the following questions -----
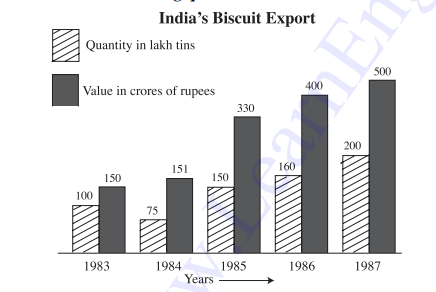
What was the percentage drop in export quantity from 1983 to 1984 ?View SolutionStudy the graph carefully and answer the following questions.
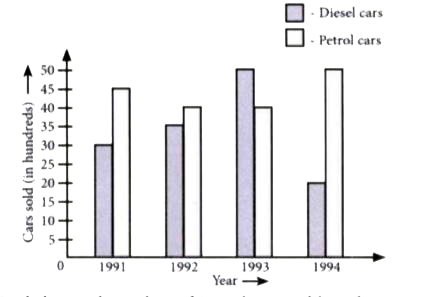
Find the total number of Diesel cars sold in the year 1992 and 1994 together.View SolutionStudy the graph carefully and answer the following questions.
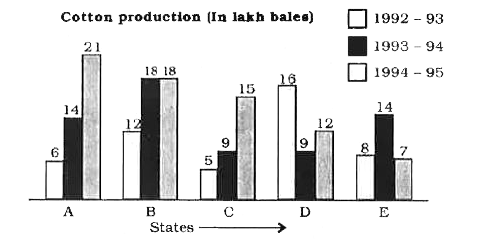
What is the average production of the four states in the year 1994-95 taken together ?View Solution


