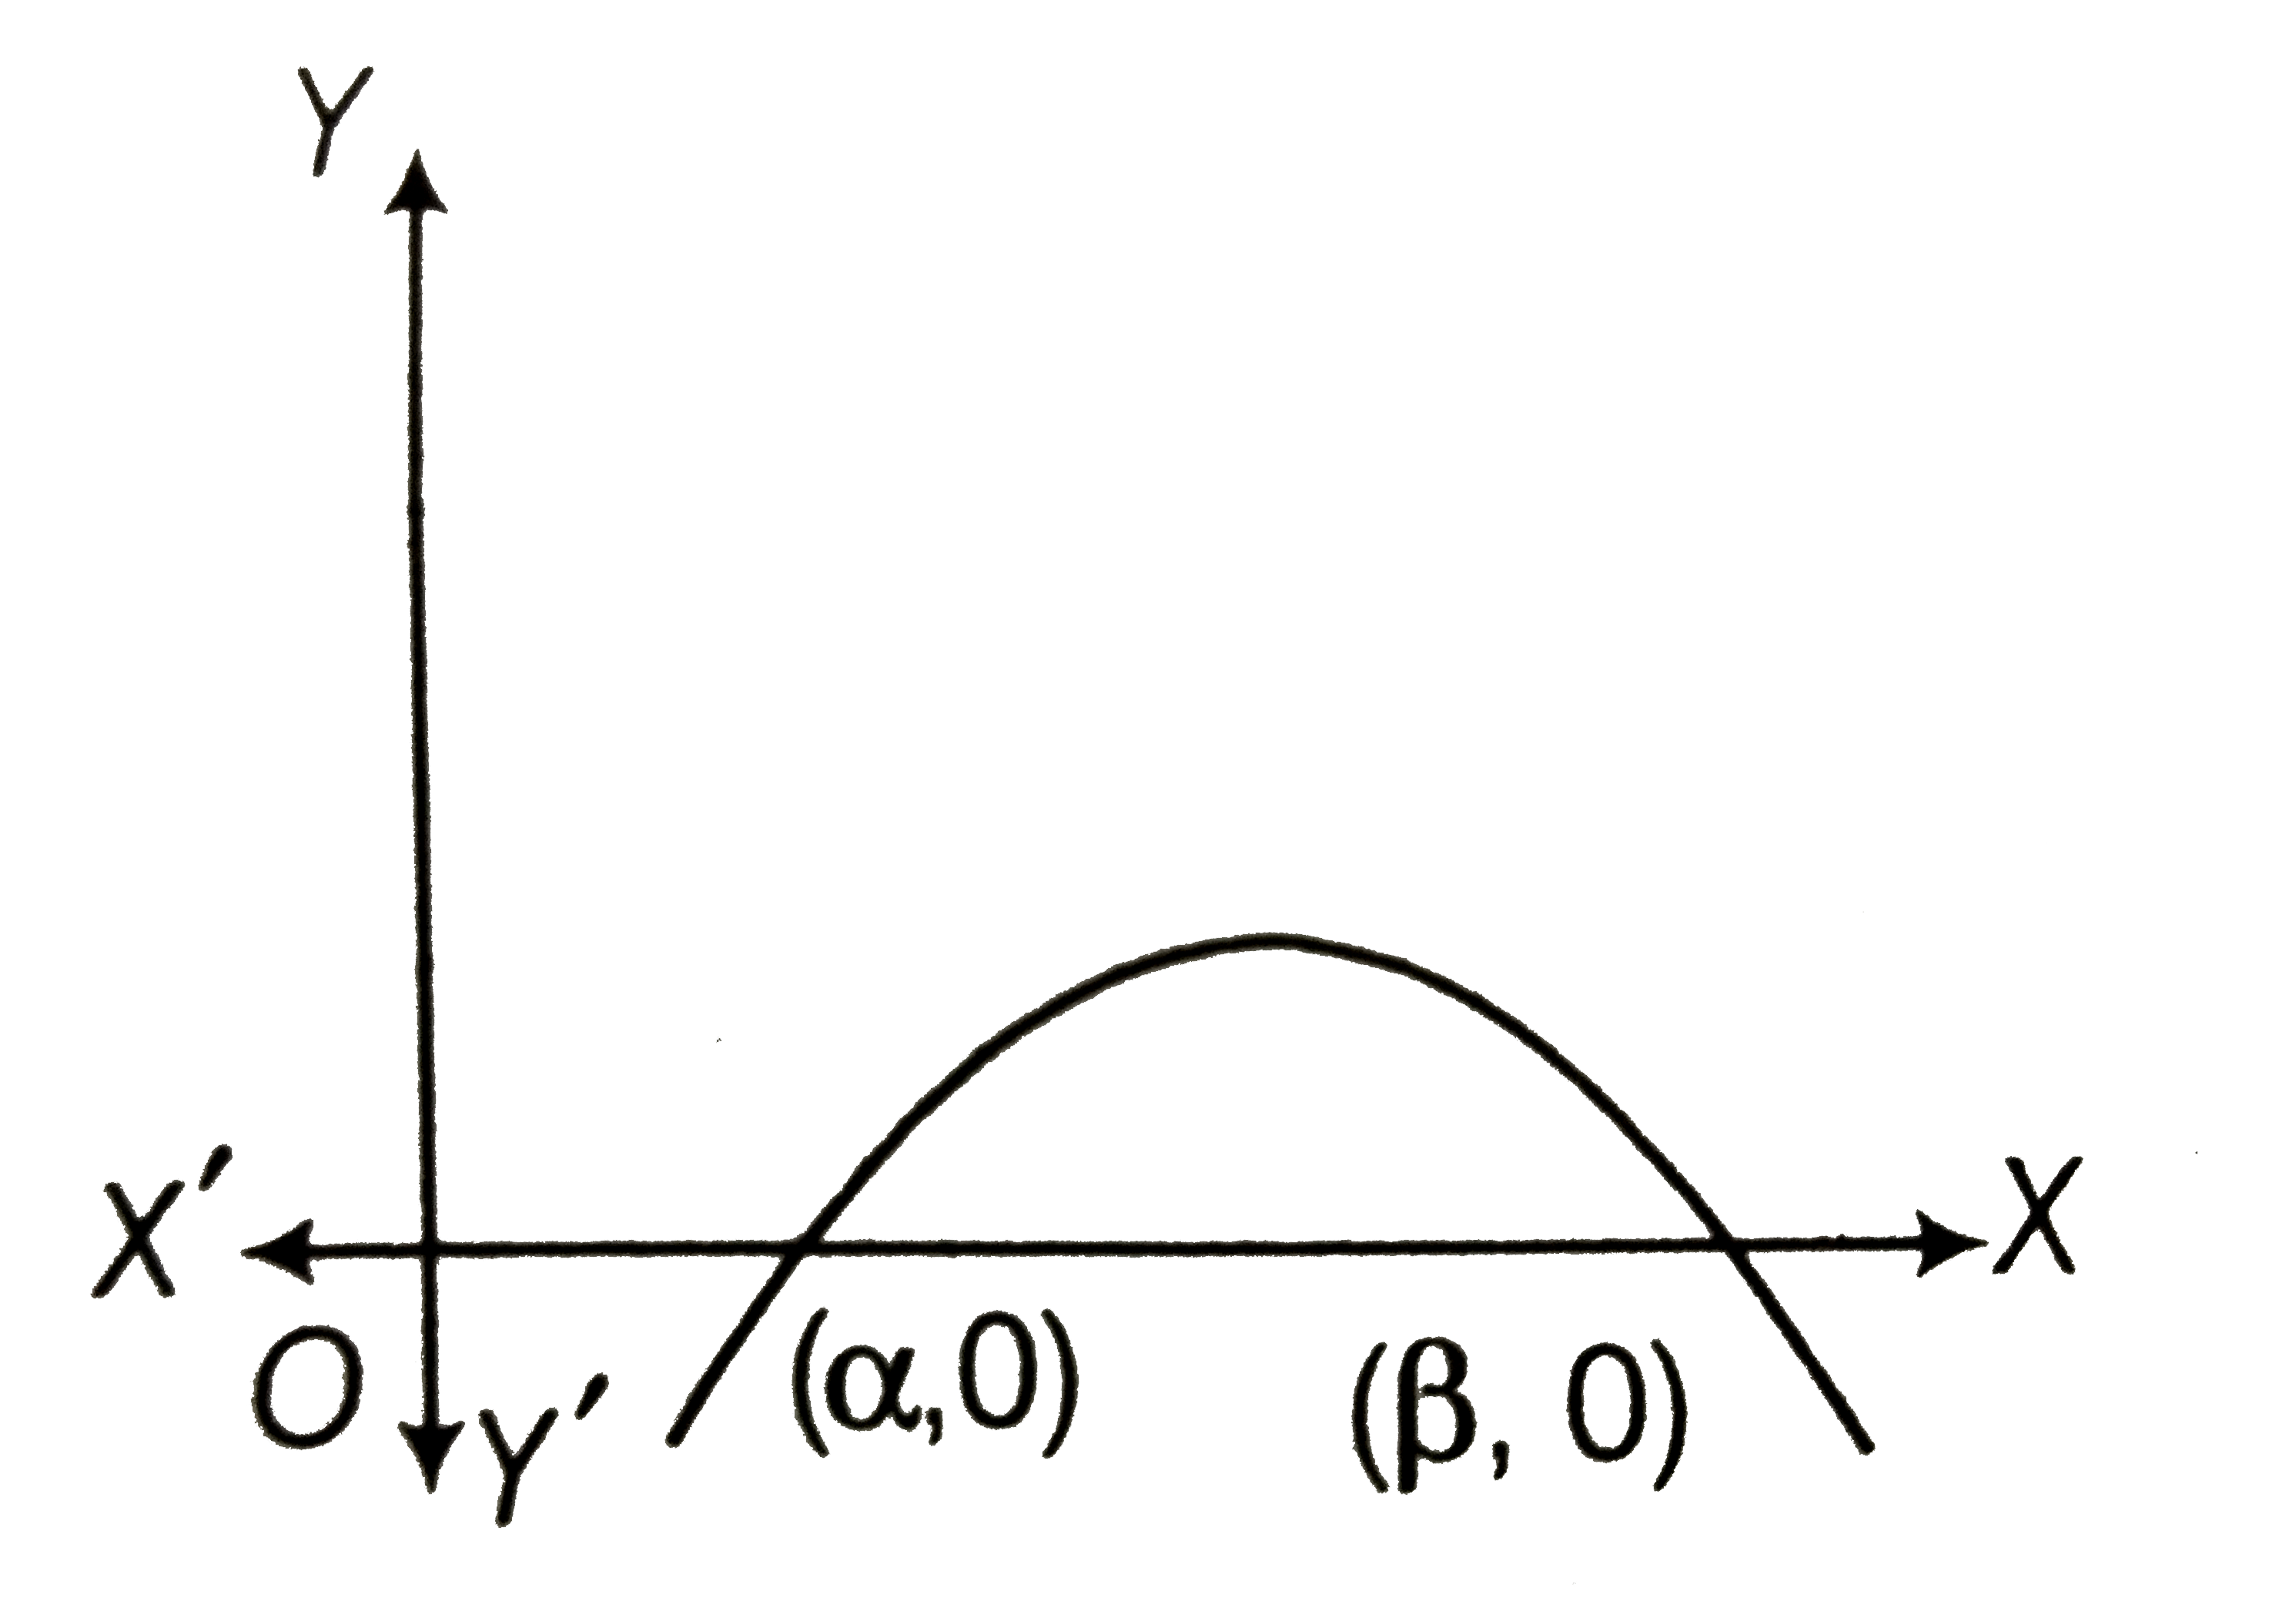
The adjoining graph of y=ax2+bx+c shows that
 Solution in Punjabi
(a) a<0
(b) b2<4ac
(c) c>0
(d) a and b are of opposite signs
The correct Answer is:A, D
It is clear from graph that the equation y=ax2+bx+c=0 has two real and distinct roots. Therefore
b2−4ac>0………..i
∴ Parabola open downwards.
a<0
and y=ax2+bx+c cuts off Y axis at x=0
∴y=c<0
⇒c<0
and x-coordinate of vertex >0
⇒−b2a>0⇒ba<0
⇒b>0[∵a<0]
It is clear that a and b are of opposite signs.
Topper's Solved these Questions
- THEORY OF EQUATIONSBOOK - ARIHANT MATHSCHAPTER - THEORY OF EQUATIONSEXERCISE - Exercise (Passage Based Questions)
21 Videos
- THEORY OF EQUATIONSBOOK - ARIHANT MATHSCHAPTER - THEORY OF EQUATIONSEXERCISE - Exercise (Single Integer Answer Type Questions)
10 Videos
- THEORY OF EQUATIONSBOOK - ARIHANT MATHSCHAPTER - THEORY OF EQUATIONSEXERCISE - SCQ_TYPE
1 Videos
- THE STRAIGHT LINESBOOK - ARIHANT MATHSCHAPTER - THE STRAIGHT LINESEXERCISE - The Straight Lines Exercise 8 : (Questions Asked in Previous 13 years Exams)
1 Videos
- THREE DIMENSIONAL COORDINATE SYSTEMBOOK - ARIHANT MATHSCHAPTER - THREE DIMENSIONAL COORDINATE SYSTEMEXERCISE - Three Dimensional Coordinate System Exercise 12 : Question Asked in Previous Years Exam
2 Videos
Similar Questions
If G and L are the greatest and least values of the expression2x2−3x+22x2+3x+2,xεR respectively.
The least value of G100+L100 is
View SolutionThe sum of all the real roots of the equation |x−2|2+|x−2|−2=0 is
View SolutionFrom the graph of a quadratic polynomial y=ax2+bx+c,a,b,εR , Find its vertex, roots and D.
View SolutionSolve the following system of inequalities graphically
x+5y≤25,2x+2y≥2,2x−2y≤0,x≥0,y≥0
View SolutionConsider the line L1:x−12=y−1=z+31,L2:x−41=y+31=z+32 find the angle between them.
View SolutionHow many lines of symmetry does the above figure have ?
View SolutionWhich of the following are correct chain isomers of butane ? (i)
View SolutionDetermine the point of symmetry of a regular hexagon.
View SolutionDtermine the images of the following figure about the given line :
View SolutionMatch the following Column A to Column B

View SolutionMatch the following Column A to Column B

View SolutionMatch the following Column A to Column B

View SolutionFind the area of the figure given below.

View SolutionThe area of the shaded part in the figure given below is ______.

View SolutionThe inequation represented by the graph given below is :
View SolutionThe inequation that best describes the graph given below is _________
View Solution
