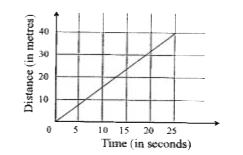
A boy is cycling at a constant speed. His distance versus time graph will look like
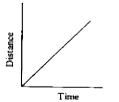
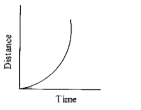

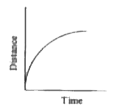
To determine what the distance versus time graph of a boy cycling at a constant speed looks like, we can follow these steps:
1. Understanding Distance vs. Time Graphs:
- A distance vs. time graph plots distance on the y-axis and time on the x-axis. The slope of this graph represents speed.
2. Constant Speed Definition:
- When an object is moving at a constant speed, it means that the distance it covers in equal intervals of time is the same. This results in a straight line on the graph.
3. Identifying the Slope:
- The slope of the distance vs. time graph indicates the speed. For constant speed, the slope must remain constant over time. This means that the line should not curve or change its steepness.
4. Analyzing the Options:
- Look at the provided options for the distance vs. time graph:
- Option 1: A straight line with a positive slope (indicating constant speed).
- Option 2: A curve that gets steeper (indicating increasing speed).
- Option 3: A horizontal line (indicating stationary).
- Option 4: A curve that flattens out (indicating decreasing speed).
5. Choosing the Correct Graph:
- Since the boy is cycling at a constant speed, the correct graph will be the one that shows a straight line with a constant positive slope. This corresponds to Option 1.
Final Answer:
The distance vs. time graph of a boy cycling at a constant speed will look like a straight line with a constant positive slope (Option 1).
---
- A distance vs. time graph plots distance on the y-axis and time on the x-axis. The slope of this graph represents speed.
- When an object is moving at a constant speed, it means that the distance it covers in equal intervals of time is the same. This results in a straight line on the graph.
- The slope of the distance vs. time graph indicates the speed. For constant speed, the slope must remain constant over time. This means that the line should not curve or change its steepness.
- Look at the provided options for the distance vs. time graph:
- Option 1: A straight line with a positive slope (indicating constant speed).
- Option 2: A curve that gets steeper (indicating increasing speed).
- Option 3: A horizontal line (indicating stationary).
- Option 4: A curve that flattens out (indicating decreasing speed).
- Since the boy is cycling at a constant speed, the correct graph will be the one that shows a straight line with a constant positive slope. This corresponds to Option 1.
The distance vs. time graph of a boy cycling at a constant speed will look like a straight line with a constant positive slope (Option 1).
Topper's Solved these Questions
- MOTIONBOOK - BEIITIANSCHAPTER - MOTIONEXERCISE - CONCEPTIVE WORKSHEET
20 Videos
- MOTIONBOOK - BEIITIANSCHAPTER - MOTIONEXERCISE - SUMMATIVE WORKSHEET
2 Videos
- MEASUREMENTBOOK - BEIITIANSCHAPTER - MEASUREMENTEXERCISE - IIT JEE WORKSHEET (IV INTEGER TYPE)
1 Videos
- SOUNDBOOK - BEIITIANSCHAPTER - SOUNDEXERCISE - IIT JEE Worksheet (V. Matrix Matching)
5 Videos
Similar Questions
Knowledge Check
If a particle moves with a constant speed, the distance-time graph is
Astraight lineBcircleCstairlike lineDpolygonIf a particle moves with a constant speed, the distance-time graph is
Astraight lineBcurved lineChorizontal line to time axisDparallel line to velocity axisA paratrooper id dropped from an airplane. After some time his parachute opens and he reaches the ground with almost zero speed. This speed of fall (v) versus time (t) grapg will look like :
A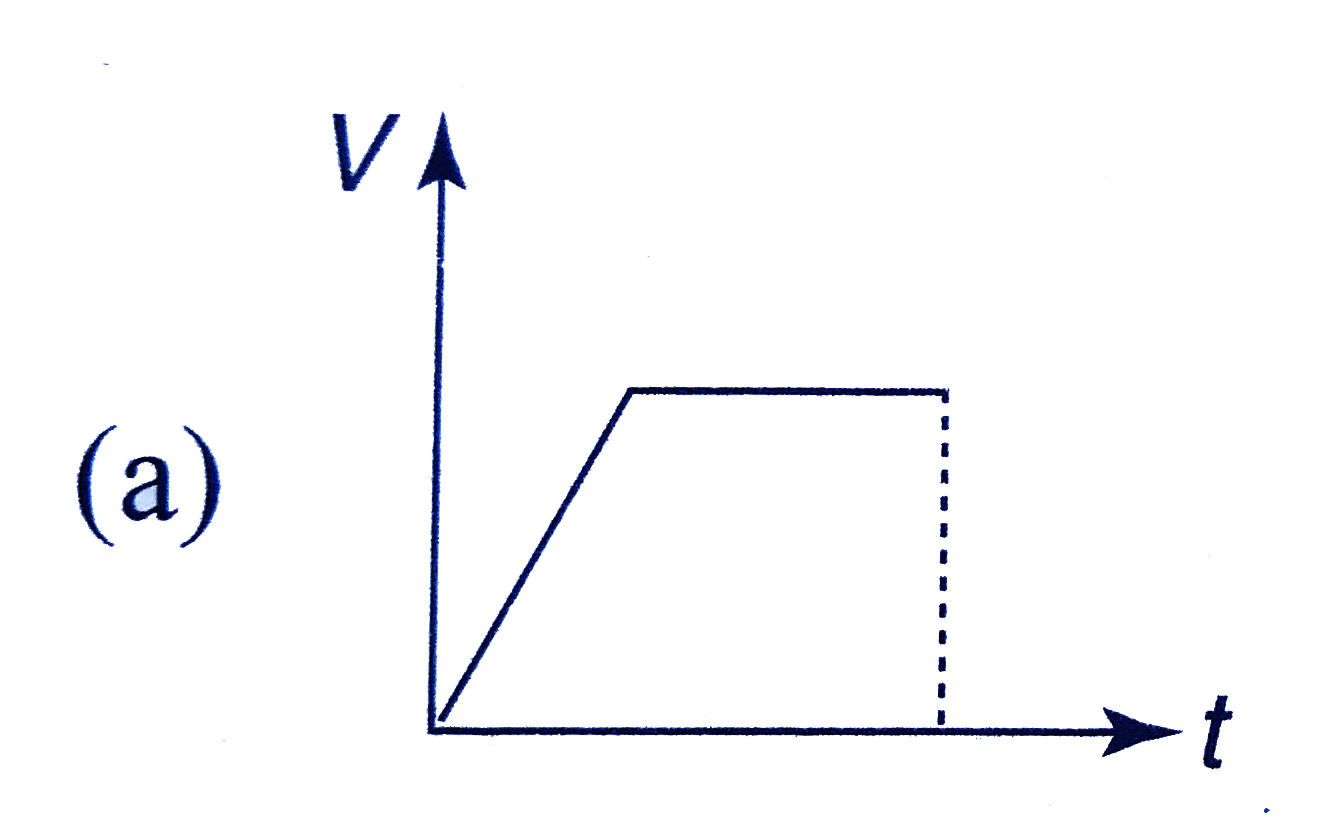 .B
.B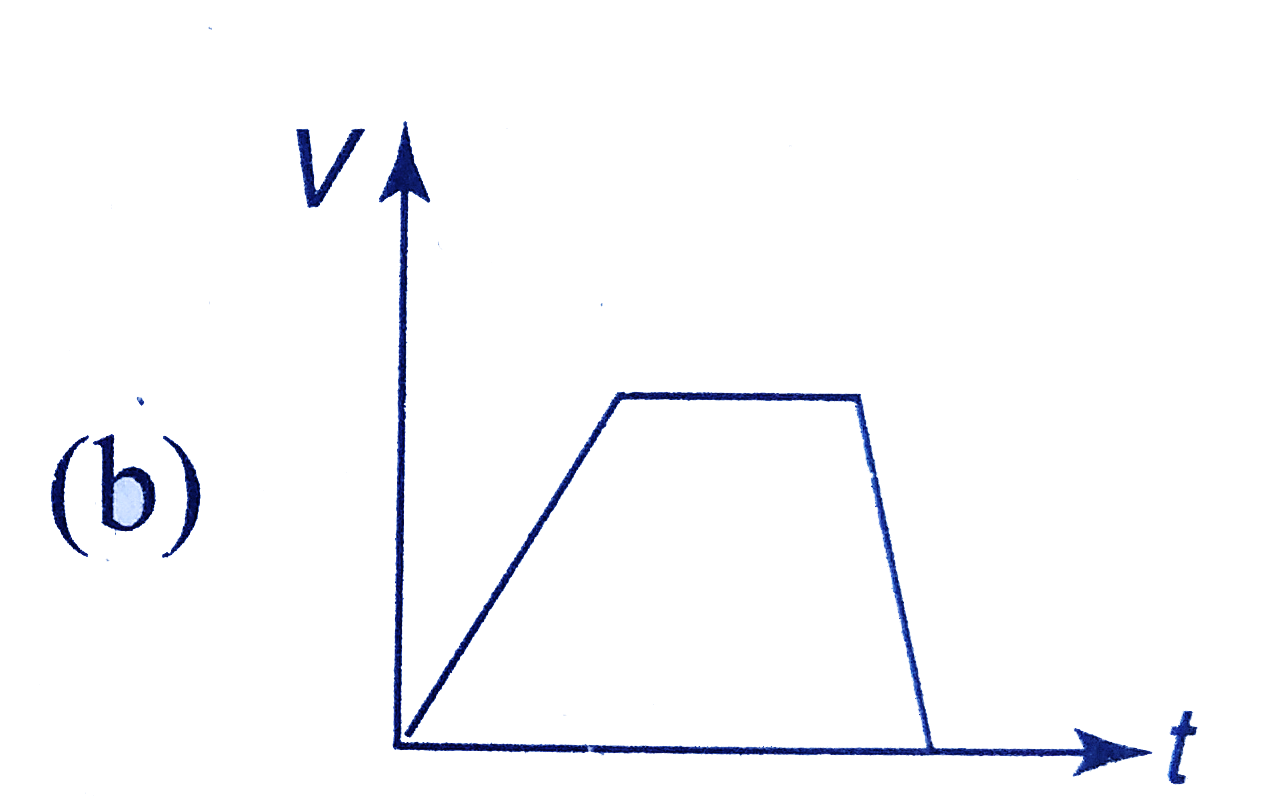 .C
.C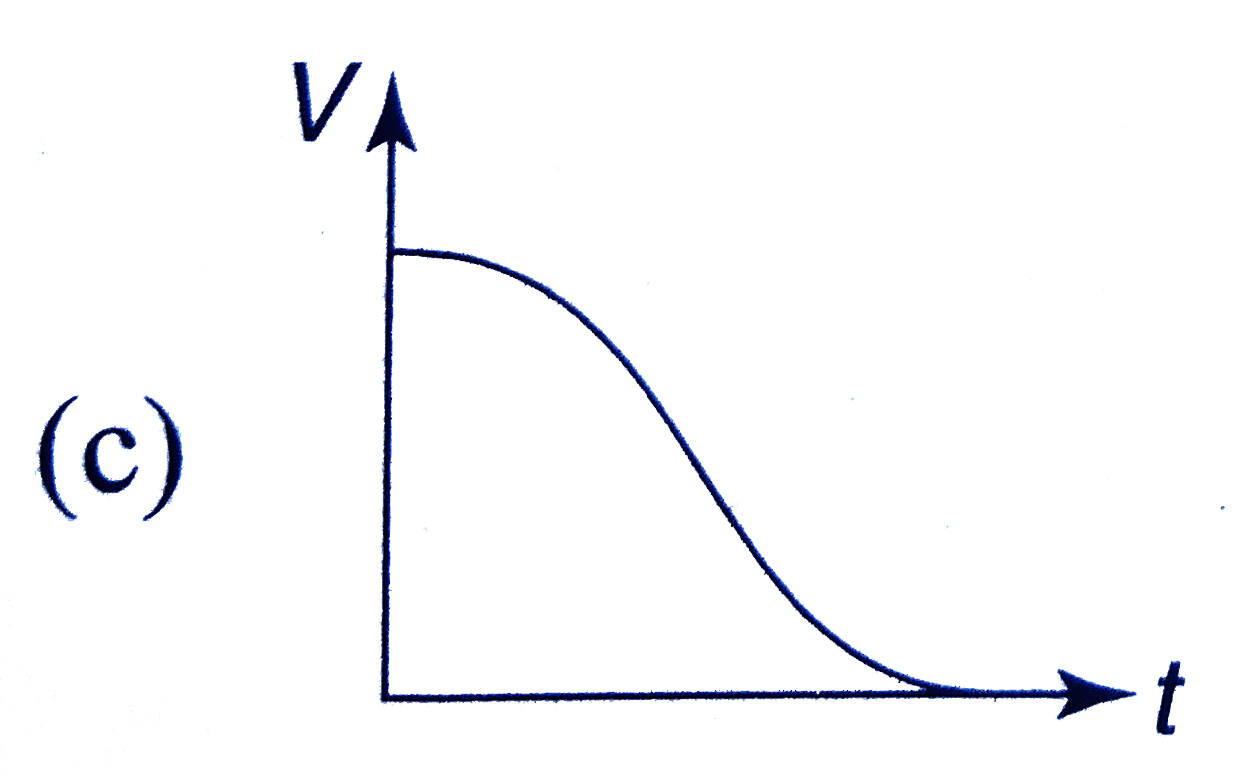 .D
.D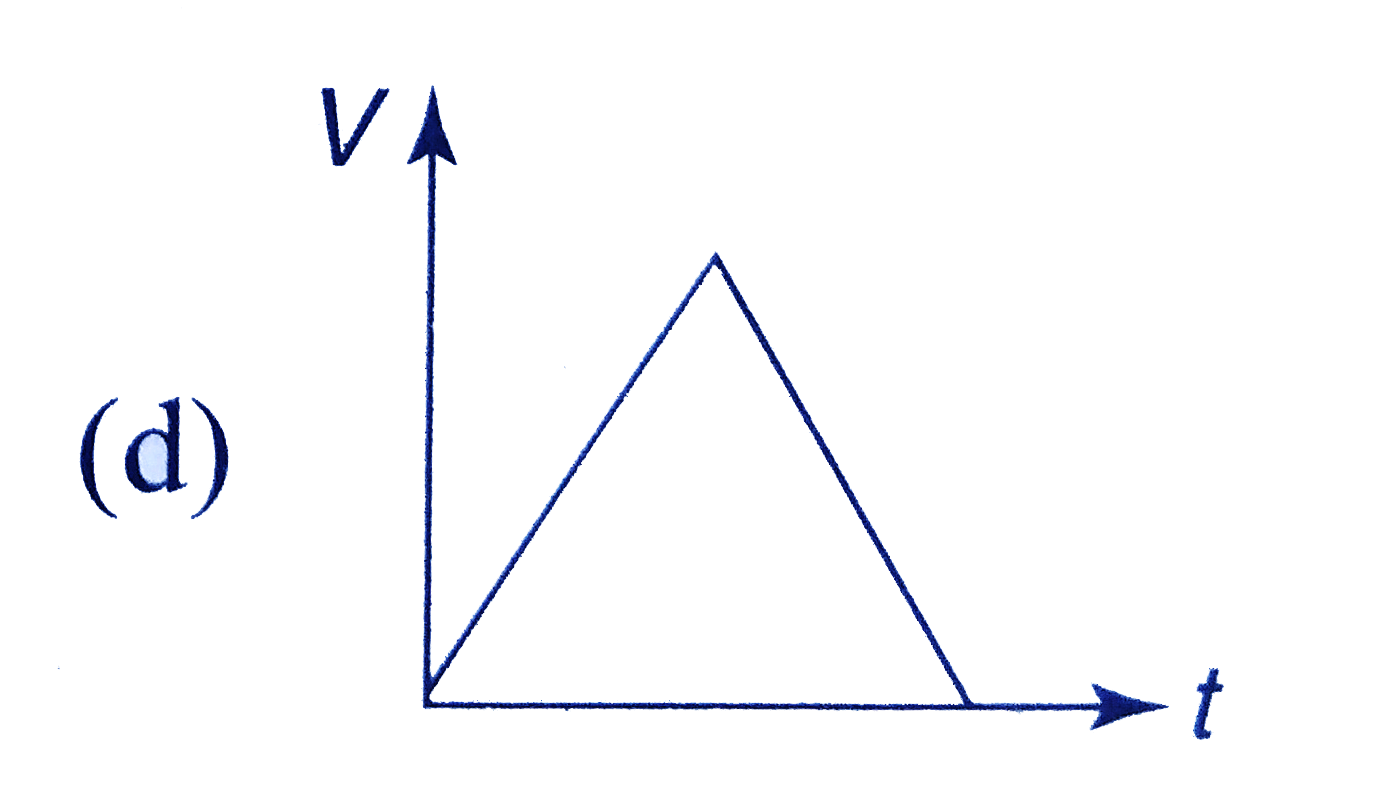 .
.
Four cars A,B and C are moving on a levelled road. Their distance versus time graphs are shown in Fig. Choose the correct statement
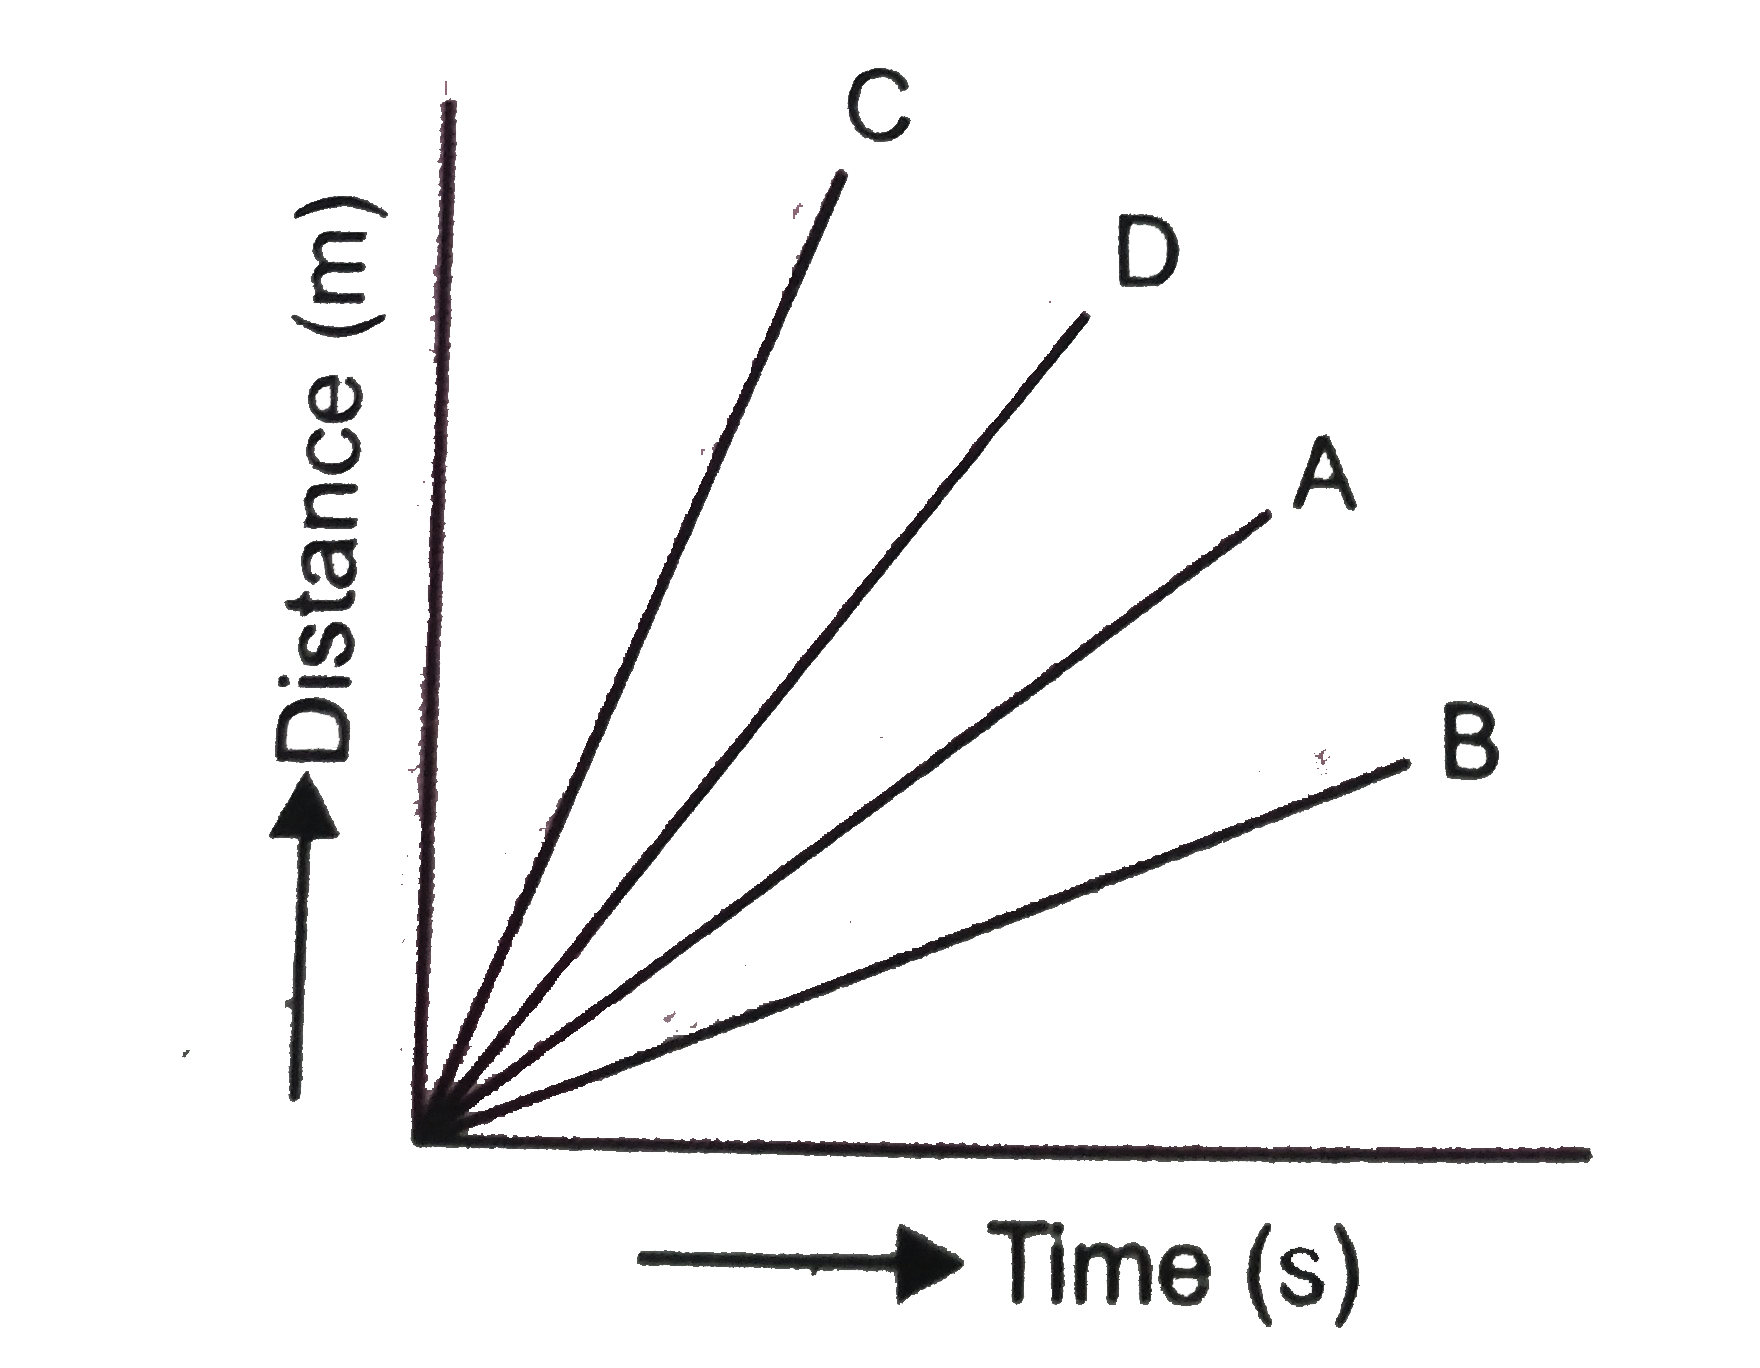
View SolutionA car parked on a road side from sometimes , starts moving with a constant speed . Which of the following distance- time graph shows the motion of that car ?
View SolutionA car parked on a road side from sometime, starts moving with a constant speed. Which of the following distance-time graph shows the motion of that car ?
View SolutionAcceleration versus time graph of a particle moving in a straight line is as shown in adjoining figure. If initially particle was at rest. Then corresponding kinetic energy versus time graph will be :
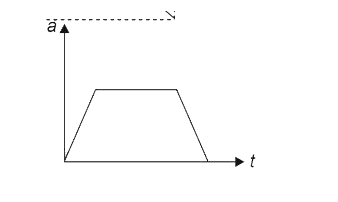
View SolutionLook at the given distance -time graph of an object .
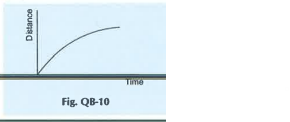
View Solution

