The table shows the production of different types of cars by a company in 5 years.
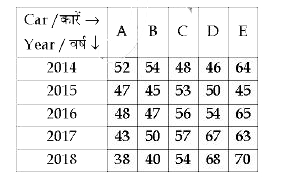
If the data related to the production of cars in 2018 is represented by pie chart, then the central angle of the sector representing the production of type c cars will be:
72∘
59∘
93∘
91∘
The correct Answer is:A
Step by step video, text & image solution for The table shows the production of different types of cars by a company in 5 years. If the data related to the production of cars in 2018 is represented by pie chart, then the central angle of the sector representing the production of type c cars will be: by Maths experts to help you in doubts & scoring excellent marks in Class 14 exams.
Topper's Solved these Questions
Similar Questions
The table shows the production of different types of cars by a company (in thousands) in 5 years.
 If the data related to the production of cars in 2018 is represented by pie chart, then the central angle of the sector representing the production of type C cars will be:
यदि 2018 में कारों के उत्पादन से संबंधित आंकड़ों को एक पाई-चार्ट में प्रस्तुत किया जाए, तो C प्रकार की कारों के उत्पादन को दर्शाने वाले खंड का केंद्रीय कोण होगा :View SolutionThe table shows the production of different types of cars (in thousands).
यह तालिका एक कंपनी द्वारा अलग-अलग कारों के उत्पादन (हज़ार में ) को दर्शाती है |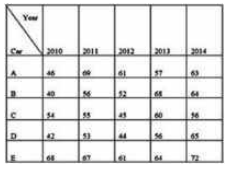 If the data related to the production of type C cars is represented by a pie-chart, then the central angle of the sector representing production of cars in 2012 will be:
यदि C प्रकार की कारों के उत्पादन से संबंधित आंकड़ों को एक पाई-चार्ट में प्रस्तुत किया जाए, तो 2012 में कारों के उत्पादन को दर्शाने वाले खंड का केंद्रीय कोण होगा :View Solution
Knowledge Check
- Question 1 - Select One
The table shows the production of different types of cars by a company ( in thousands) in 5 years.

If the data related to the production of cars in 2018 is represented by pie chart, then the central angle of the sector representing the production of type C cars will be:Aa) 93∘Bb) 72∘Cc) 59∘Dd) 91∘ - Question 2 - Select One
The table shows the production of different types of cars (in thousands).
यह तालिका एक कंपनी द्वारा 5 वर्षों में अलग-अलग कारों के उत्पादन (हज़ार में ) को दर्शाती है | If the data related to the production of type D cars is represented by a pie chart, then the central angle of the sector representing the production of
cars in 2013 will be:
यदि D प्रकार की कारों के उत्पादन से संबंधित आंकड़ों को एक पाई-चार्ट में प्रस्तुत किया जाए, तो 2013 में कारों के उत्पादन को दर्शाने वाले खंड का केंद्रीय कोण होगा :A84∘B75∘C60∘D77∘ - Question 3 - Select One
The table shows the production of different types of cars (in thousands).
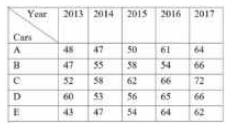
If the data related to the production of type D cars is represented by a pie chart, then the central angle of the sector representing the production of cars in 2016 will be:A78∘B72∘C67.2∘D79.2∘
The table shows the production of different types of cars (in thousands).

If the data related to the production of type D cars is represented by a pie chart, then the central angle of the sector representing the production of cars in 2016 will be:View SolutionThe table shows the production of different types of cars (in thousands).
 In the data related to the production of type D cars in represented by a pie chart, then the central angle of the sector representing production of cars in 2015 will be:
यदि D प्रकार की कारों से संबंधित आंकड़ों को एक पाई-चार्ट में प्रस्तुत किया जाए, तो 2015 में कारों के उत्पादन को दर्शाने वाले खंड का केंद्रीय कोण होगा :View SolutionThe table shows the production of different types of cars ( in thousands).
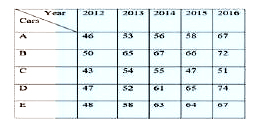
If the data related to the production of type B cars is represented by a pie chart, then the central angle for the sector representing the production of cars in 2016 is :View SolutionThe table shows the production of different types of cars (in thousands).
यह तालिका अलग-अलग प्रकार के कारों का उत्पादन ( हज़ार में) दर्शाती है |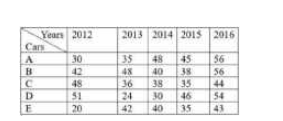 If the data related to the production of cars of type E is represented by a pie chart, then the central angle of the sector
representing the data of production of cars in 2013 will be:
यदि E प्रकार की कारों के उत्पादन से संबंधित आंकड़ों को एक पाई-चार्ट के द्वारा प्रदर्शित किया जाए, तो 2013 में कारों के उत्पादन के आंकड़ों को दर्शाने वाले खंड का केंद्रीय कोण होगा :View SolutionThe table shows the production of different types of cars (in thousands).
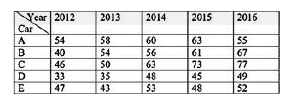
If the data related to the production of type D cars is represented by a pie chart. Then the central angle of the sector representing the production of cars in 2013 will be:View Solution

