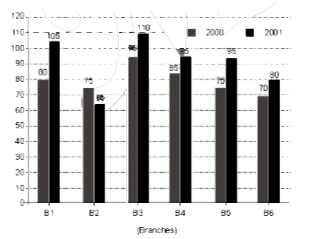
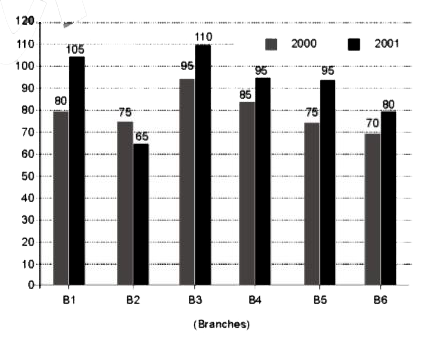
The given bar graph present the sales of the number of books by six branches of a publishing company during two consecutive years 2000 and 2001.
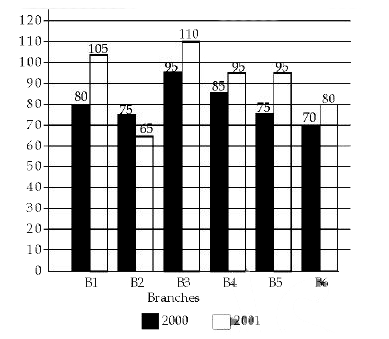
The average of total sales by all branches for both the years is:
171.37
171.57
171.27
171.67
The correct Answer is:D
Step by step video, text & image solution for The given bar graph present the sales of the number of books by six branches of a publishing company during two consecutive years 2000 and 2001. The average of total sales by all branches for both the years is: by Maths experts to help you in doubts & scoring excellent marks in Class 14 exams.
Updated on:21/07/2023Topper's Solved these Questions
Similar Questions
The given bar graph present the sales of the number of books by six branches of a publishing company during two consecutive years 2000 and 2001.

The ratio of total sales by all branches for the year 2001 to total sales by all branches for the year 2000 is:
View SolutionThe given Bar Graph present the sales of the number of books (in thousands) by six branches of a publishing company during two consecutive years 2000 and 2001.
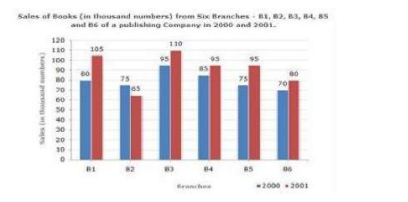
The ratio of the sales by all branches for the year 2001 to total sales by all branches for the year 2000 is:
View Solution
Knowledge Check
The given Bar Graph present the sales of the number of books (in thousands) by six branches of a publishing company during two consecutive years 2000 and 2001.
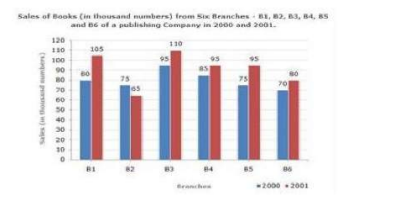 The total sales (in thousands) by all branches for both years is:
A470B560C1100D1030
The given Bar Graph present the sales of the number of books (in thousands) by six branches of a publishing company during two consecutive years 2000 and 2001.

The total sales (in thousands) by all branches for both years is:
View SolutionThe given Bar Graph present the sales of the number of books (in thousands) by six branches of a publishing company during two consecutive years 2000 and 2001.
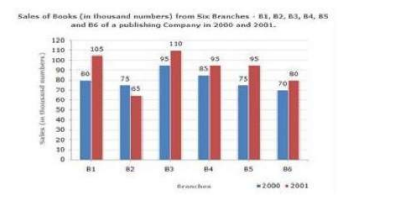
The average of total sales (in thousands and correct to decimal places)by all branches for both the years is:
View SolutionThe given bar chart shows the sales of books from six branches of a publishing company during two consecutive years 2000 and 2001.
In the given bar chart, the ratio of total sales of all branches for the year 2000 to 2001 is:
View SolutionThe given bar chart shows the sales of books from six branches of a publishing company during two consecutive years 2000 and 2001.
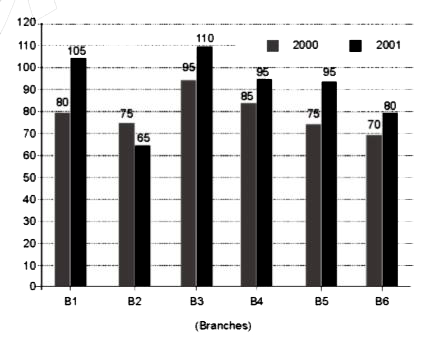
In the given bar chart, the ratio of total sales of all branches B1,B3 and B5 to total sales of branches B2,B4 and B5 taken together for both the years
View SolutionThe given bar chart, shows the sales of books (in thousand number) from six branches of a publishing company during two consecutive years 2000 and 2001.
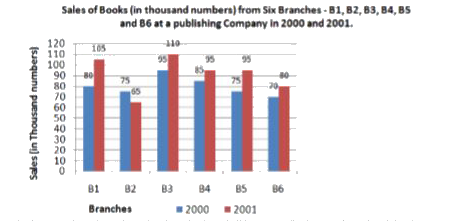
In the given bar-chart, the ratio of total sales of all branches (in thousand numbers) for the year 2000 to 2001 is:
View SolutionThe given bar chart. shows the sales of books (in thousand number) from six branches of a publishing company during two consecutive years 2000 and 2001.
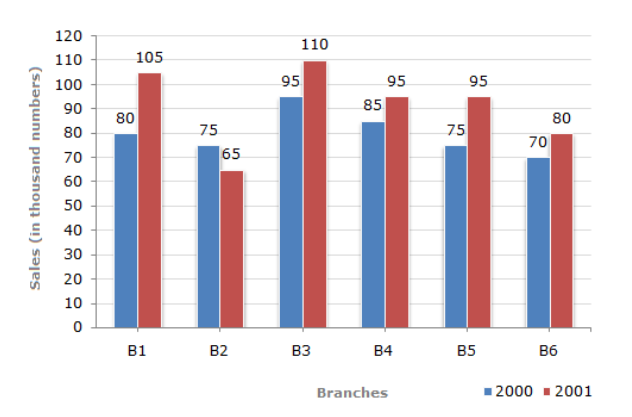
In the given bar-chart, total sales of branches B1, B3 and B5 taken together for both the years (in thousand numbers) is:
View SolutionThe given bar chart shows the sales of books from six branches of a publishing company during two consecutive years 2000 and 2001.
In the given bar chart, total sales of branches B1,B3 and B5 taken together for both the years is
View Solution