The given histogram represents the frequency distribution of average runs scored by 50 selected players from a district in a local cricket tournament
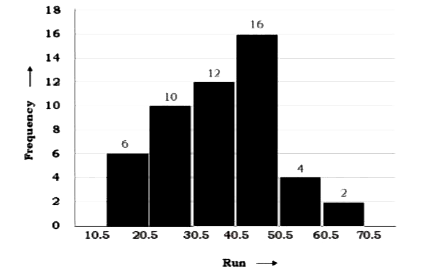
What is the overall average score of the 50 players.
37.1
29.3
32.6
38.5
The correct Answer is:A
Step by step video & image solution for The given histogram represents the frequency distribution of average runs scored by 50 selected players from a district in a local cricket tournament What is the overall average score of the 50 players. by Maths experts to help you in doubts & scoring excellent marks in Class 14 exams.
Updated on:21/07/2023Topper's Solved these Questions
Similar Questions
The given histogram represents the frequency distribution of average runs scored by 50 selected players from a district in a local cricket tournament
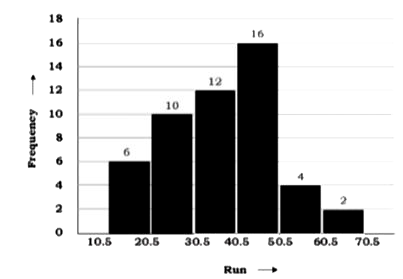
How many players scored more than 30.5 on average
View SolutionThe give histogram represents the frequency distribution of average runs scored by 50 selected players from a district in a local cricket tournament
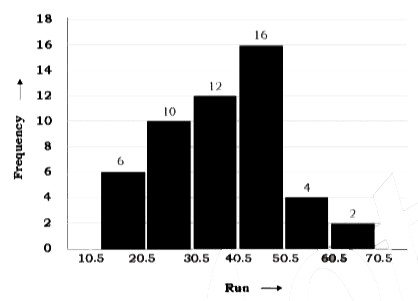
Which class of boundaries does the frequency of 10 correspond to
View Solution
Knowledge Check
Average runs scored by 11 players of a cricket team is 23. If the first player scored 113 runs. Find the average runs of the remaining players.
A8 runsB12 runsC14 runsD27 runsWhat is the average run scored by the batsman man in the five matches?
AA.50BB.49CC.45DD.46.25The average runs scored by a batsman In 7 matches Is 53 and In other 9 matches the average Is 33. What is the average runs scored by the batsman In 16 matches?
A41.75B44.25C47D49.175
The table given below shows the runs scored by 5 players in four matches.
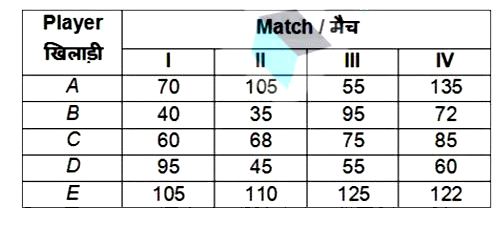
What is the correct order of averages of the given players in the 4 matches?
View Solution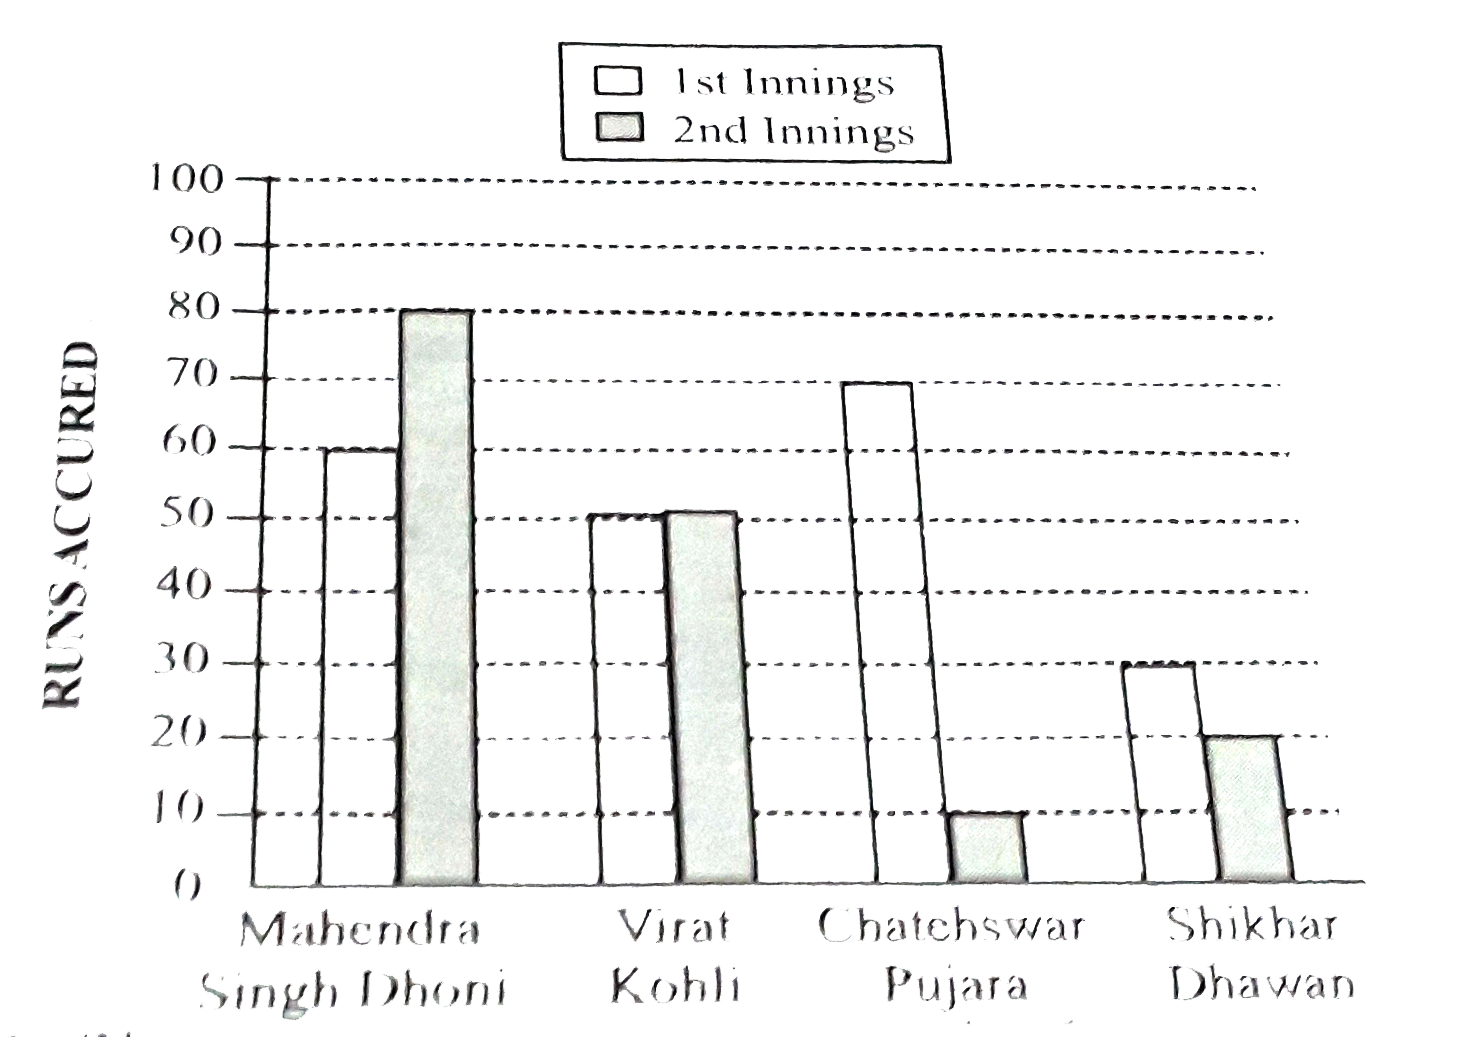
The averag run of two innins of the player scored highest in averages is :
View SolutionThe table given below shows the runs scored by 5 players in four matches .
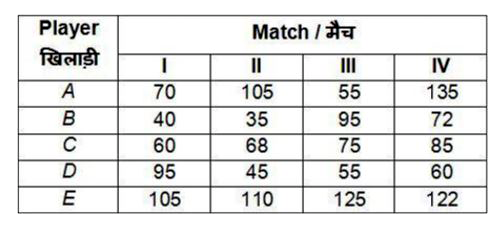
Runs scored by A in match II is what percent of the total runs scored by these five players in match II?
View SolutionRohit scored 44, 42, 62, 74, 40, and 26 runs in a six-match one-day cricket series. What is his average score for the series?
View SolutionThe given pie-chart shows the runs scored by 5 players in a match.
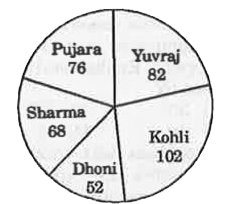
Runs scored by Pujara is what per cent of total runs scored by all these five palyers?
View Solution
