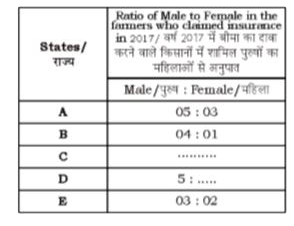
The following pie chart and table show the percentage distribution of farmers in 5 states A B C D E of a country who claimed insurance due to drought in the year 2017 and ratio of males to females to farmers in states, respectively 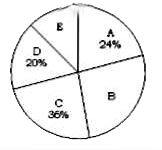
The number of farmers who claimed insurance C exceeds the total number of farmers in state E and state A together by 5280 What is the percentage of farmers who claimed insurance in state.
0.15
0.25
0.1
0.4
The correct Answer is:C
Step by step video & image solution for The following pie chart and table show the percentage distribution of farmers in 5 states A B C D E of a country who claimed insurance due to drought in the year 2017 and ratio of males to females to farmers in states, respectively The number of farmers who claimed insurance C exceeds the total number of farmers in state E and state A together by 5280 What is the percentage of farmers who claimed insurance in state. by Maths experts to help you in doubts & scoring excellent marks in Class 14 exams.
Updated on:21/07/2023Topper's Solved these Questions
Similar Questions
Knowledge Check
The following pie-chart and table show the percentage distribution of farmers in 5 states A, B, C, D & E of a country who claimed insurance due to drought in the year 2017 and ratio of males to females of the number of farmers in states, respectively. Study the pie-chart and the table carefully and answer the following questions.
Note: Some data are missing in the pie-chart and table, if required in any question, find the missing data first and then answer the question.
Total number of farmers who claimed insurance in the year 2017 = 2,64,000
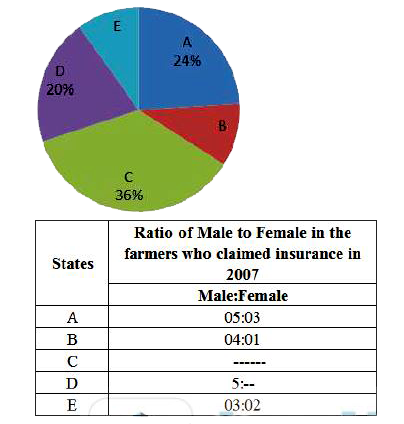
The number of farmers who claimed insurance in state C exceeds the total number of farmers (who claimed insurance)in state E and state A together by 5280. What is the percentage of farmers who claimed insurance in state E?A0.15B0.25C0.1D0.4The following table shows the percentage distribution of the population of five states, A,B,C,D and E on the basis of the poverty line and also on the basis of sex.
निम्नलिखित तालिका गरीबी रेखा तथा लिंग के आधार पर पाँच राज्यों A,B,C, D तथा E की आबादी के प्रतिशत वितरण को दर्शाती है | If the population of males below the poverty line for State C is 3 million, then what is the total
population of State C?
यदि राज्य C में गरीबी रेखा से नीचे पुरुषों की आबादी 30 लाख है, तो राज्य C की कुल आबादी कितनी है ?A24.486 millionB23.361 millionC25.617 millionD26.316 millionWhat is the total number of candidates clearing the entrance exam from states E and F together in the year 2006?
 A16160B110660C1.1066D1106600
Percentage break up of tourist who visited across various states of India and the ratio of men to women in them. And Total number of tourists =1800
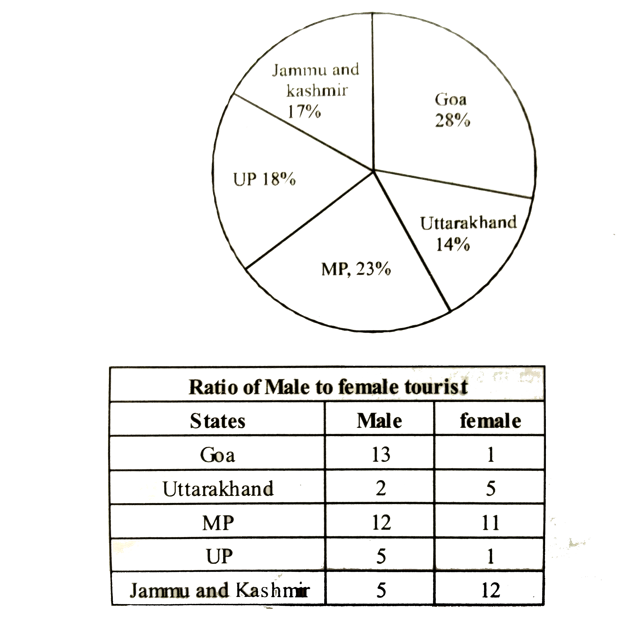
The number of female tourists who visited MP are what per cent of the total number of tourists who visited all states together ?
View Solution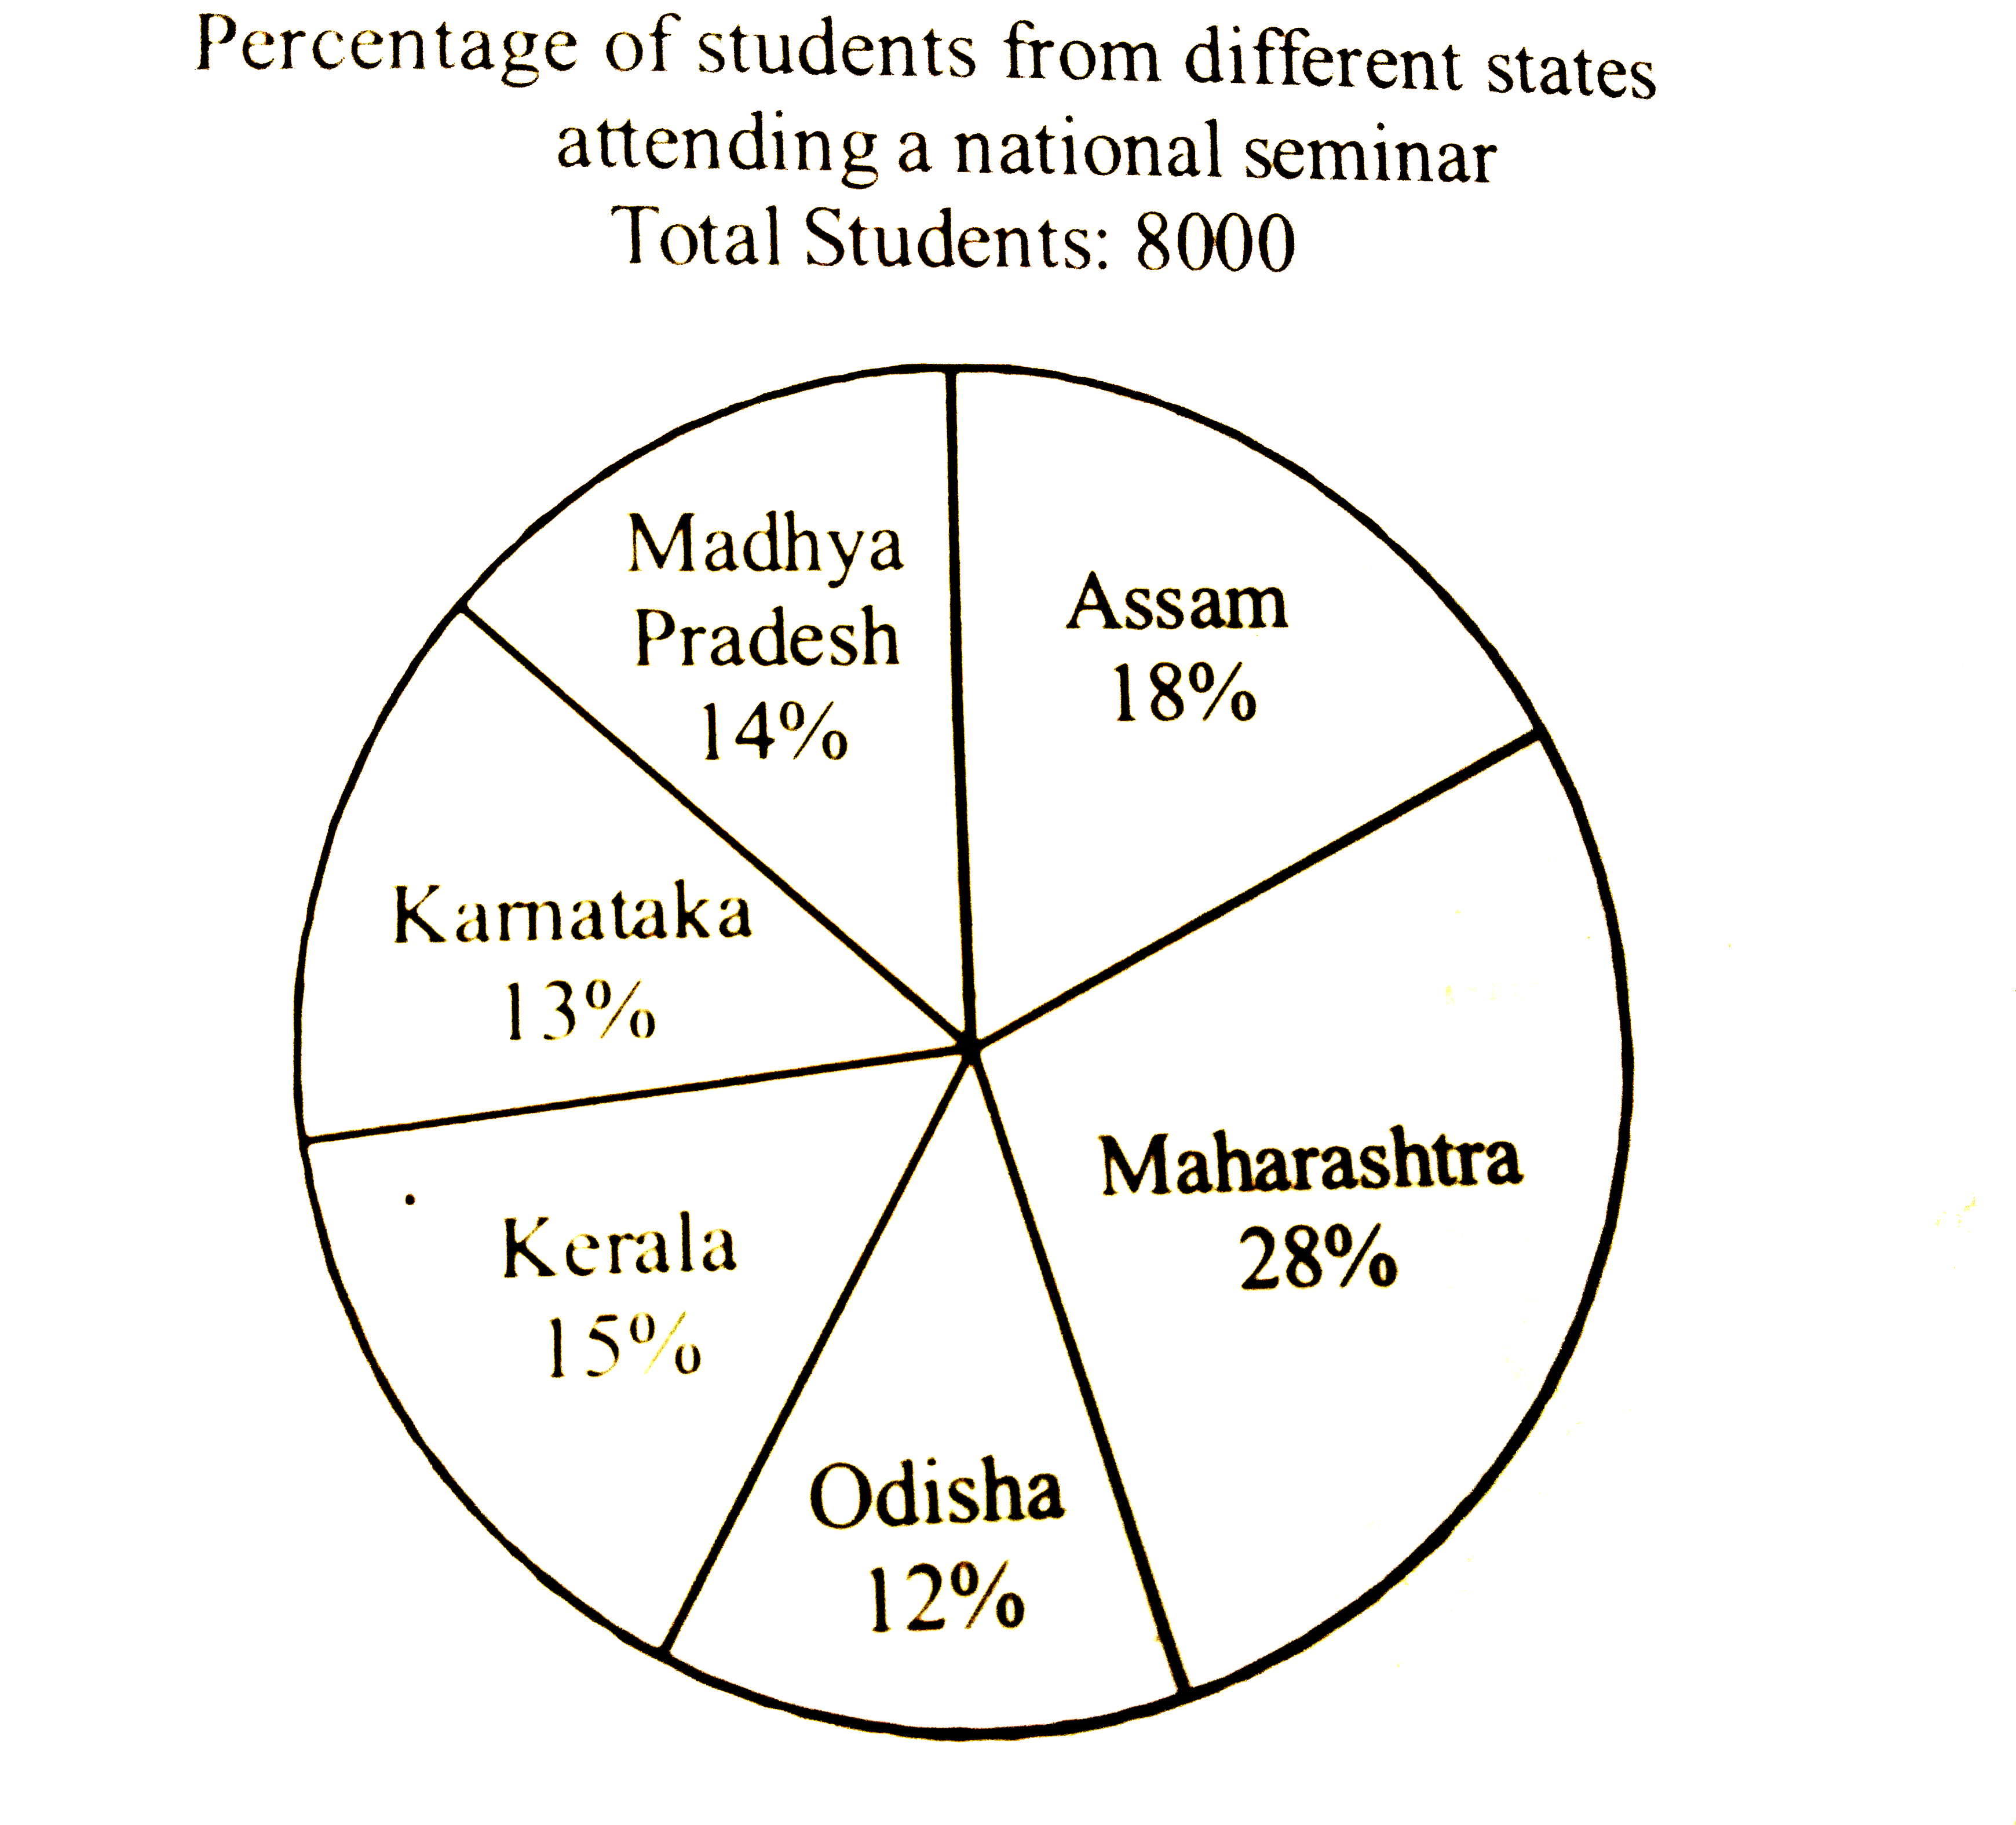
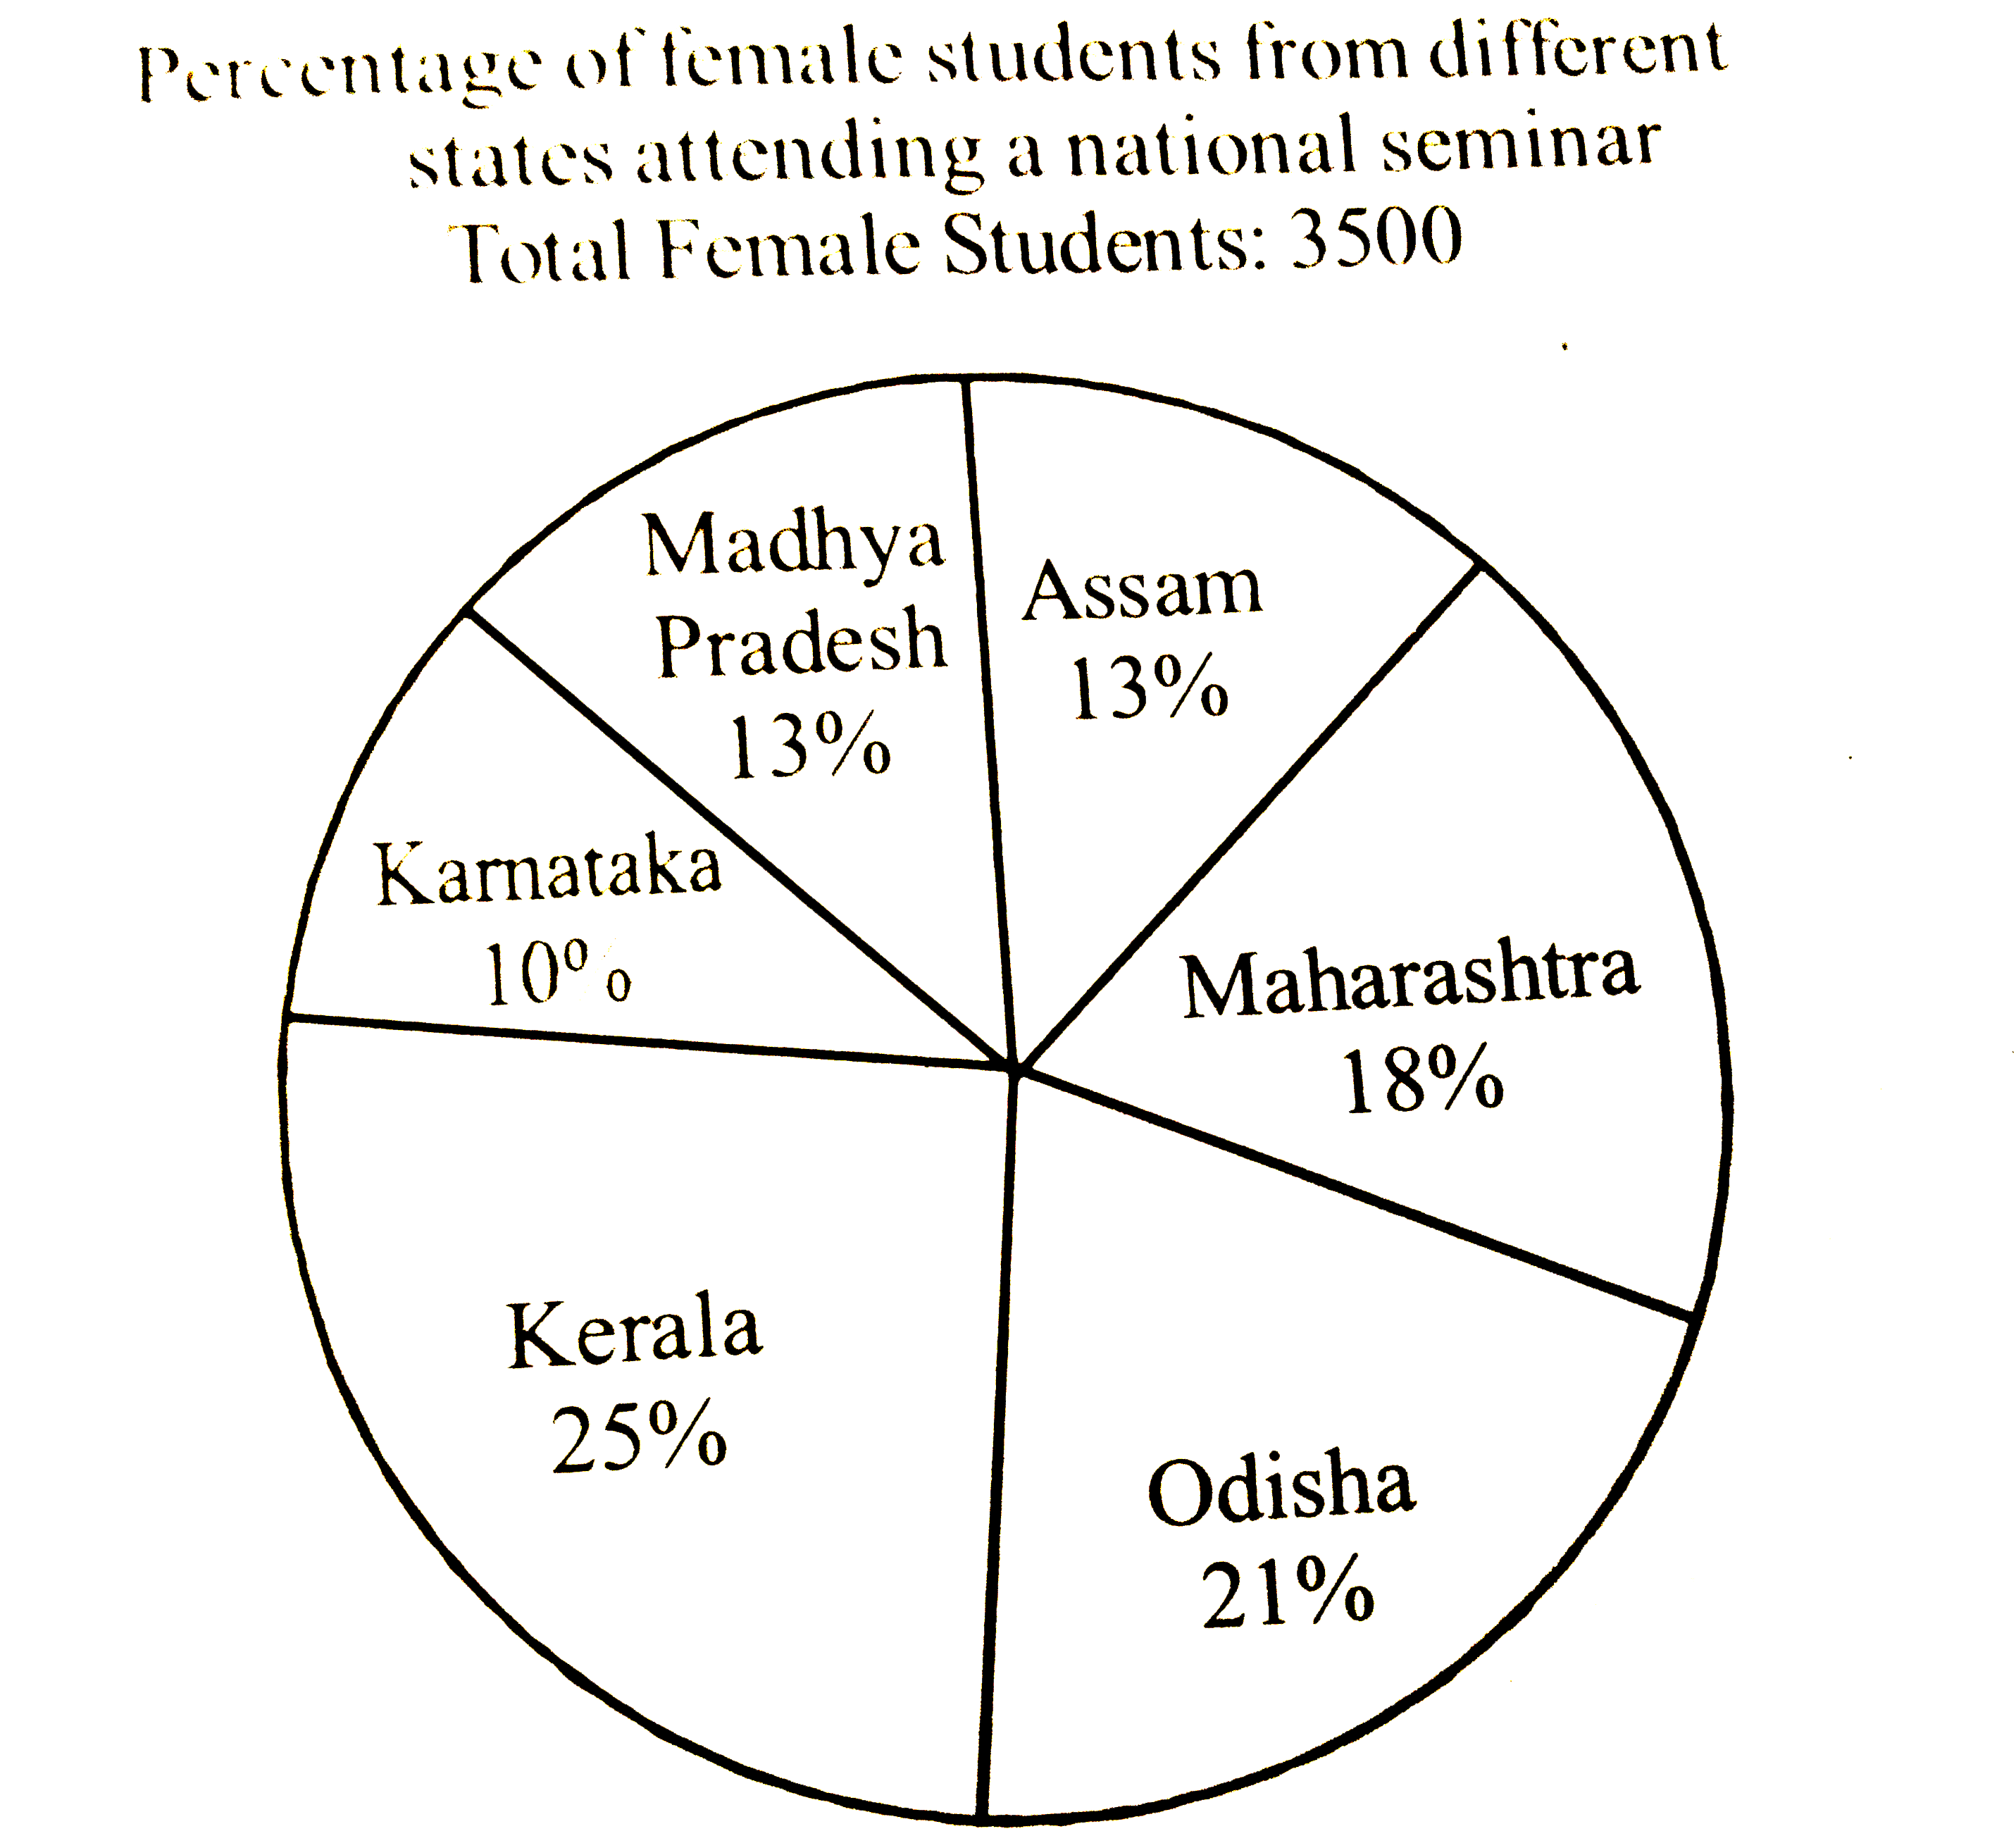
What is the respective ratio between the number of female students from Karnataka and the number of male students from the same state ?
View Solution
What is the ratio of the number of males to the number of females respectively in Patna Bank A, Bank C and Bank E together ?
View Solution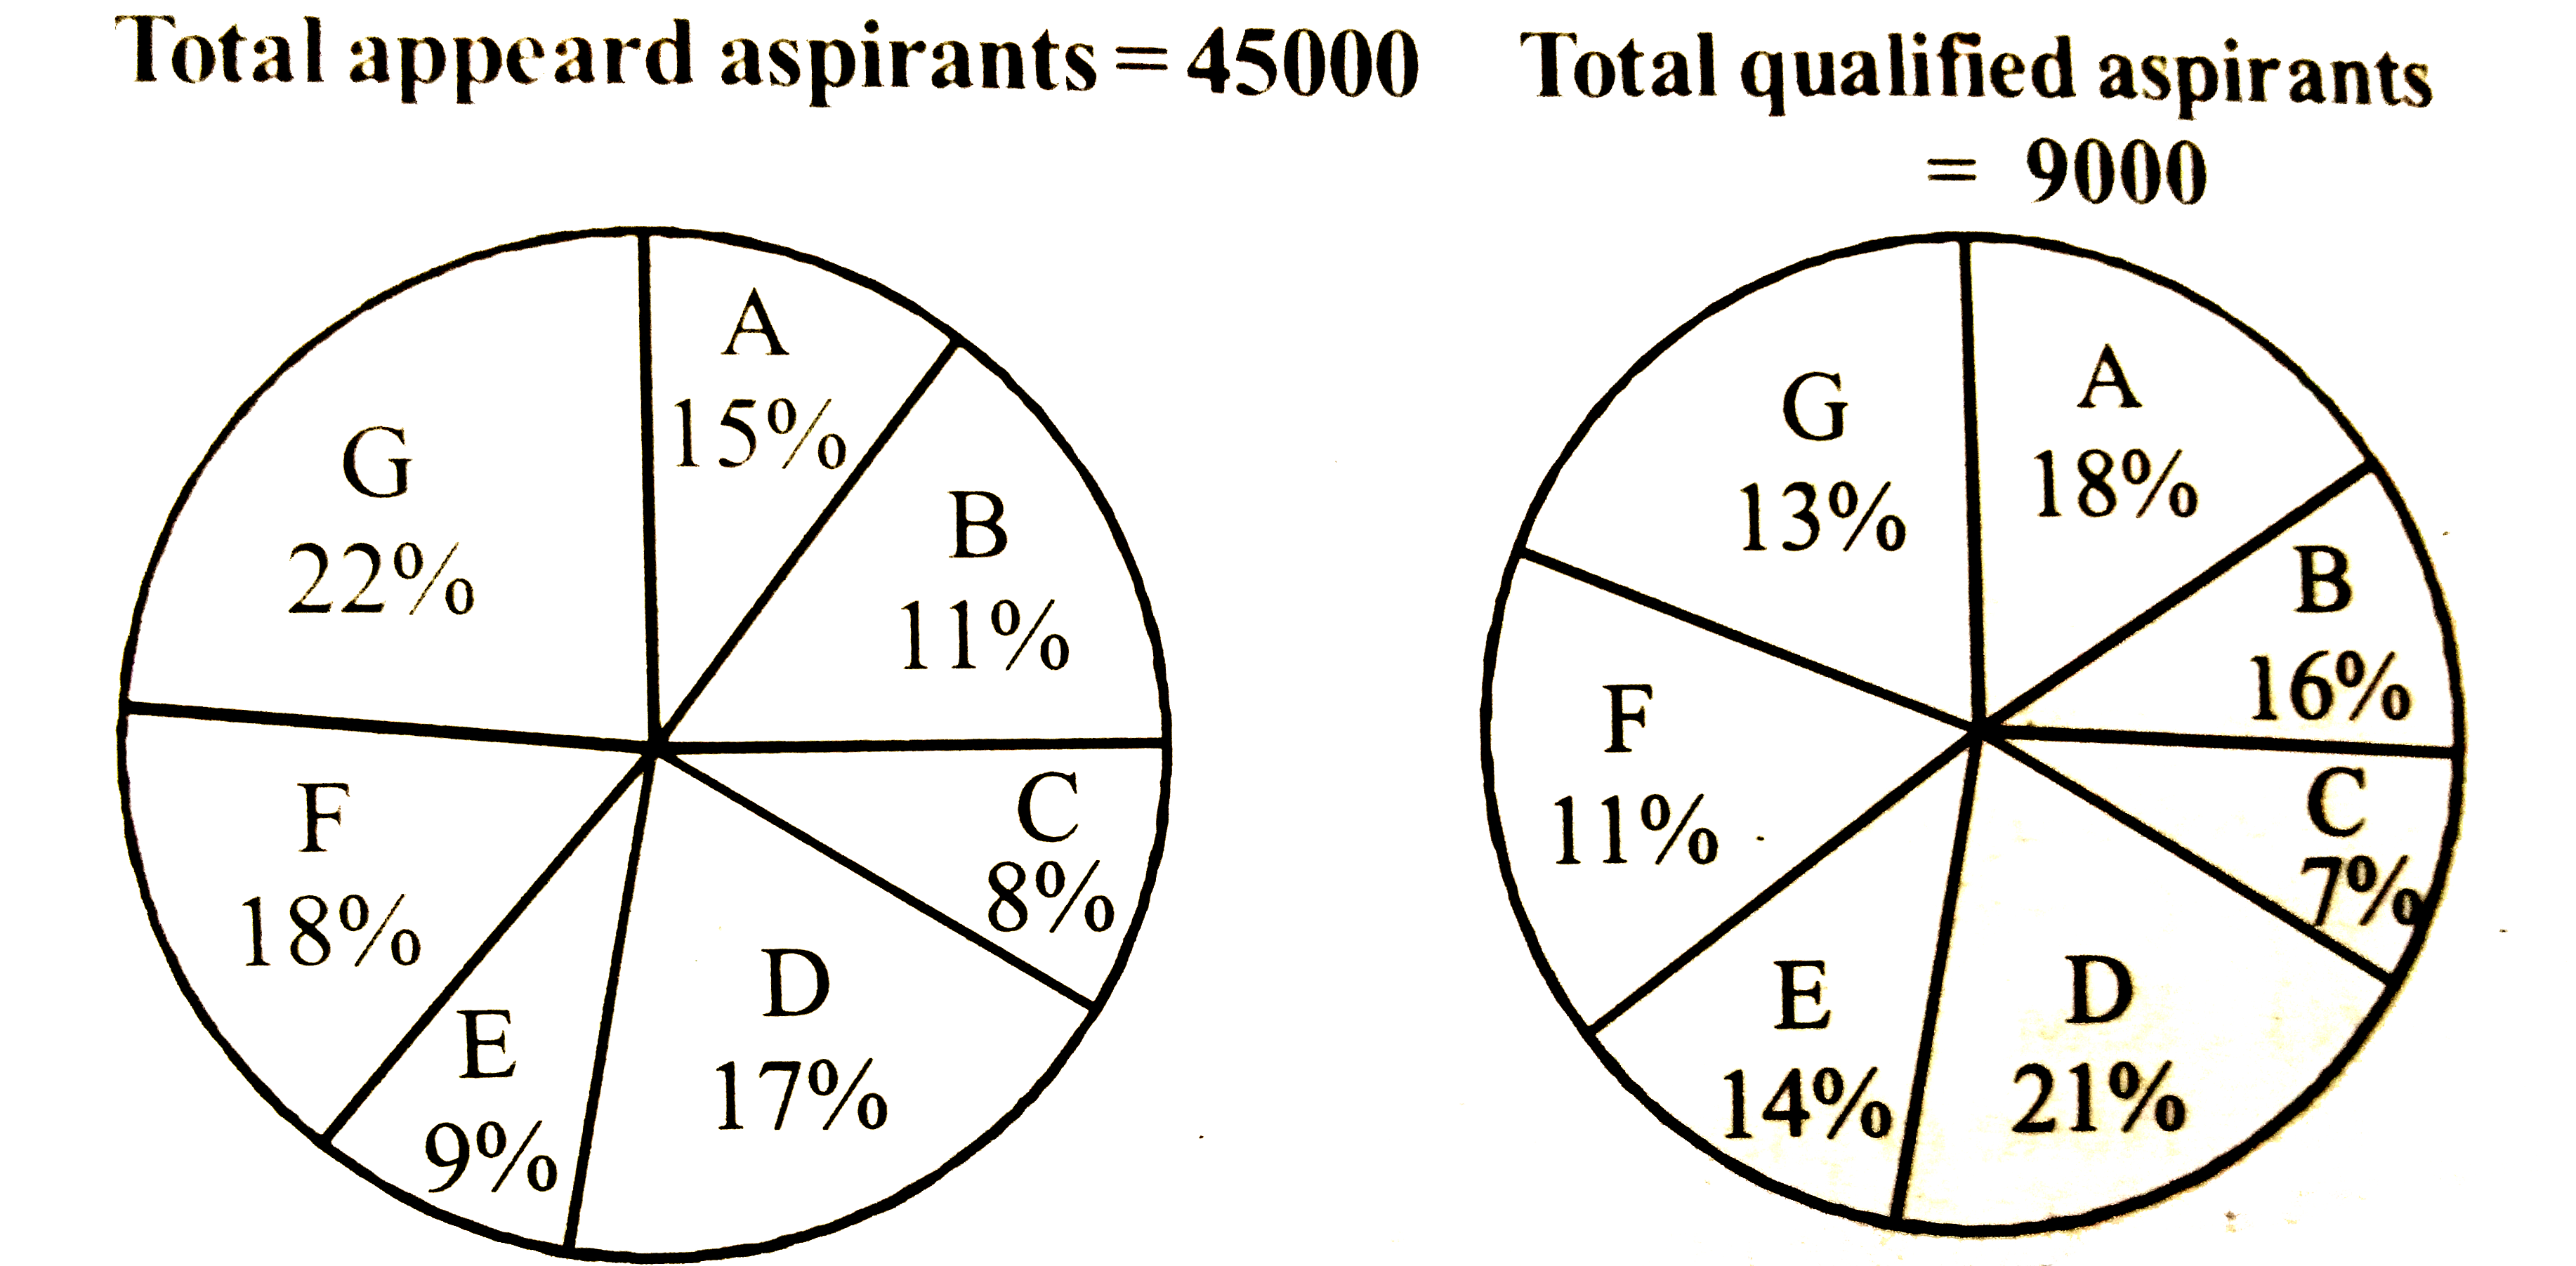
What is the ratio of the number of appeared aspirants from States C and E together to that of the appeared aspirants from States A and F together ?
View Solution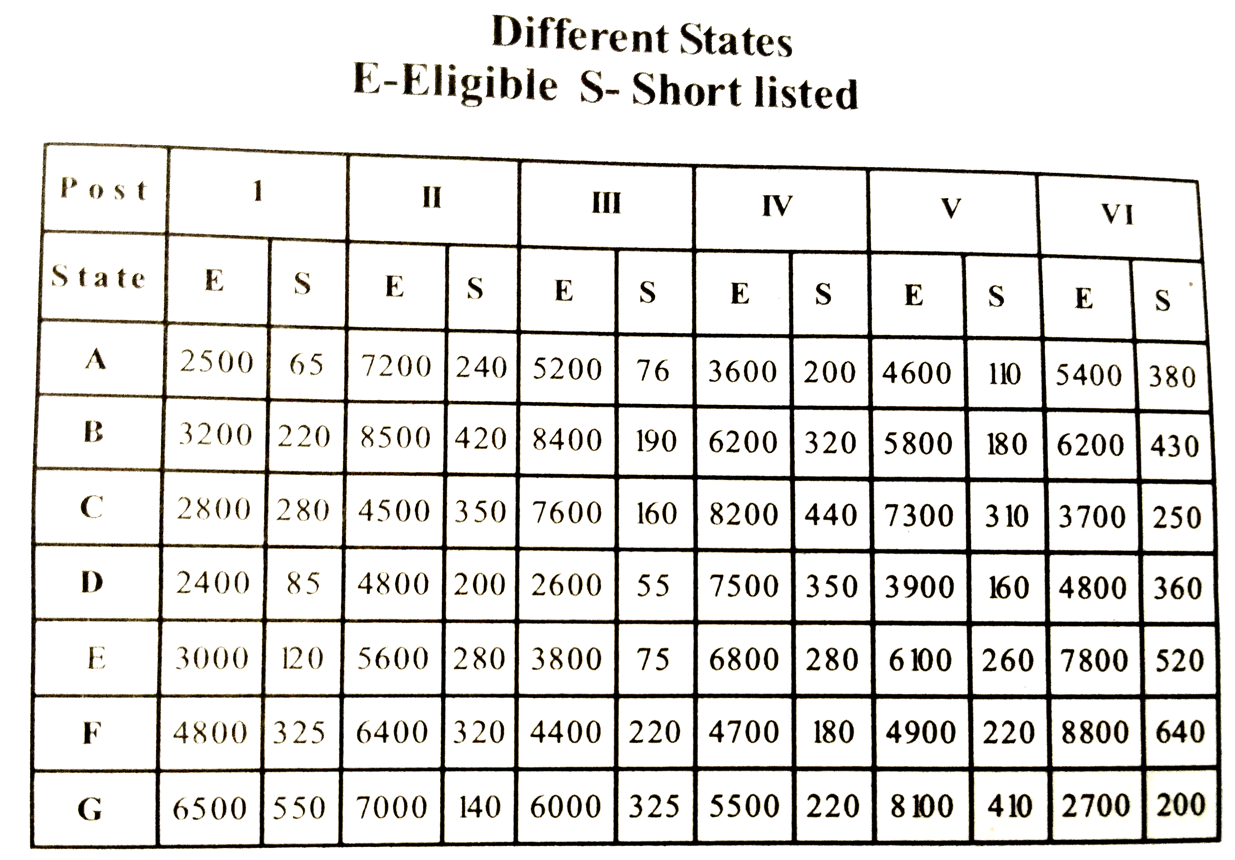
Wha is the ratio of the total number of condidates shorlisted for all the posts together from State E from state G?
View Solution

