Study the bar graph and answer the question
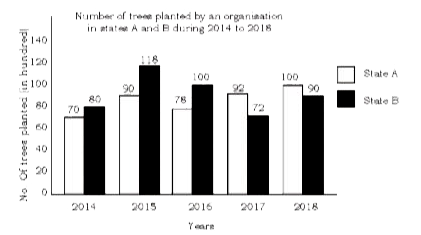
Percentage decrease in the number of trees planted in 2016 in state A as compared to that in 2015 in the same state was:
15513
1523
1313
1323
The correct Answer is:C
Step by step video & image solution for Study the bar graph and answer the question Percentage decrease in the number of trees planted in 2016 in state A as compared to that in 2015 in the same state was: by Maths experts to help you in doubts & scoring excellent marks in Class 14 exams.
Updated on:21/07/2023Topper's Solved these Questions
Similar Questions
In the given bar graph , the white bar shows the income and the black bar shows the expenditure of company (in Rs. Lakhs) . Study the graph and answer the question that follows .
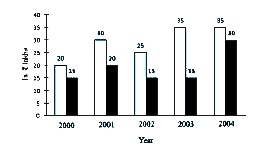
The percentage decrease in the income of the company in 2002 as compared to that in 2001 is :
View SolutionStudy the bar graph and answer the question
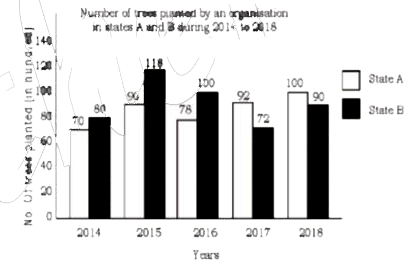
In how many years was the number of trees planted in state B more than the average number of trees planted in state A over the years
View Solution
Knowledge Check
Study the following bar graph and answer the question that follows.
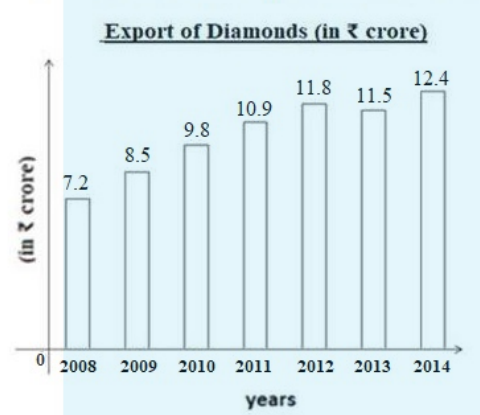
In which year was the maximin percentage increase in diamonds exports compared to the previous year?A2014B2009C2010D2012Study the following graph and answer the questions.
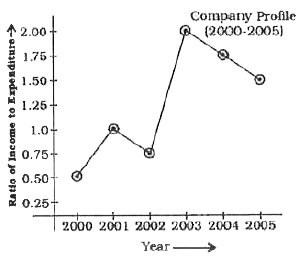
Find the percentage decrease in income from 2001 to 2002.A50%B33%C3712%DData inadequateStudy the bar graph and answer the question.
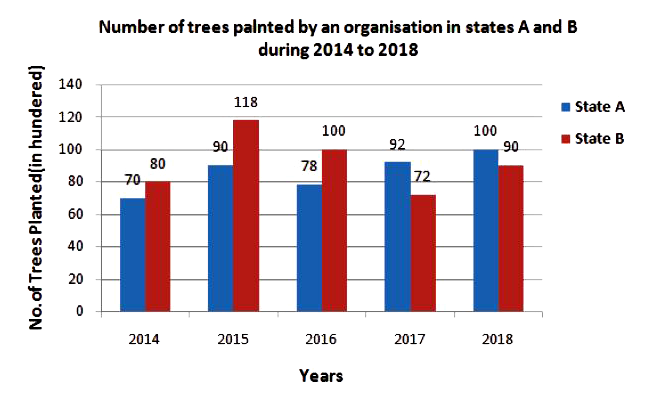
In how many years was the number of trees planted in state B more than the average number of trees planted in state A over the years ?Aa)1Bb)3Cc)4Dd)2
Study the following graph and answer questions
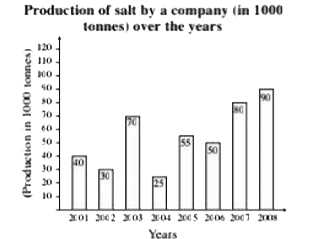
What was the percentage increase in production of salt in 2008 compared to that of 2001?
View SolutionStudy the bar graph and answer the question
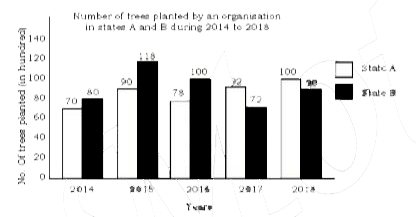
The total number of trees planted in state B in 2015 and 2017 was what percentage less than the total number of trees planted in state A in 2014 2016 and 2017
View SolutionStudy the following graph and answer the questions given below it.
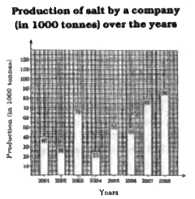
What was the percentage increase in production of salt in 2008 compared to that of 2001 ?
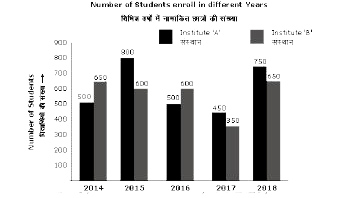
View SolutionIn the given bar graph, the percentage decrease in the number of students in institute A in 2016 is what percent of students in 2015
View Solution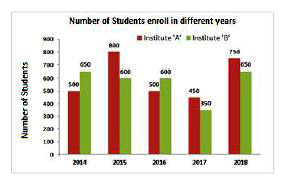
In the given bar graph, the percentage decrease in the number of students in Institute A in 2016 is what percent of students in 2015.
View Solution
