Two different companies announces to invest money at in company at a particular interest rate of their investors. The interest rate announced by company and by bank of country can be different in different years. The yearly interest rate by two companies P and Q is shown in the graph
Study the graph and answer the question
The yearly interest rate of two companies P and Q in last few years.
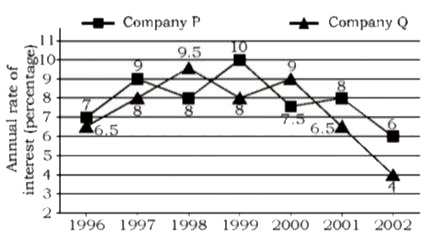
If in year 1999 two amounts in the ratio 9:10 was invested in company P and Q then the ratio of simple interest from P and Q after one year?
A . 9:8
B. 8:7
C. 8:9
D. 7:8
The correct Answer is:A
Step by step video & image solution for Two different companies announces to invest money at in company at a particular interest rate of their investors. The interest rate announced by company and by bank of country can be different in different years. The yearly interest rate by two companies P and Q is shown in the graph Study the graph and answer the question The yearly interest rate of two companies P and Q in last few years. If in year 1999 two amounts in the ratio 9:10 was invested in company P and Q then the ratio of simple interest from P and Q after one year? by Maths experts to help you in doubts & scoring excellent marks in Class 14 exams.
Updated on:21/07/2023Topper's Solved these Questions
Similar Questions
Two different companies announces to invest money at in company at a particular interest rate of their investors. The interest rate announced by company and by bank of country can be different in different years. The yearly interest rate by two companies P and Q shown in the graph
Study the graph between and answer the question
The yearly interest rate of two companies P and Q in last few years.
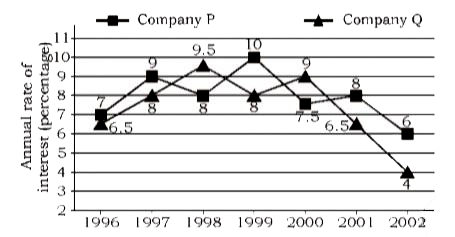
AN investor in year 2000 invested Rs 4 lakh in company Q in 2001 the complete amount was invested in company P for one year the invester will get money from company P
View SolutionThe graph shows Income and Expenditure of a company. Study the graph and answer the questions.
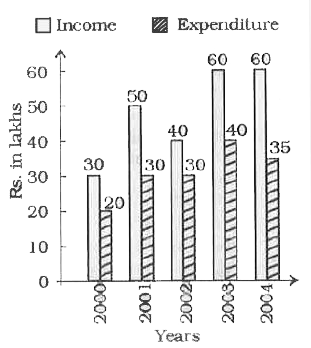
The difference in profit between 2001 and 2002 is
View Solution
Knowledge Check
Two different finance companies declare a fixed annual rate of interest on the amount invested by investors with them. The interest rate declared by these companies can vary from year to year depending on the variation in the country's economy and the interest rate of the banks. The annual rate of interest offered by the two companies P and Q is shown in the graph below. Study the graph and answer the question.
Annual percentage rate of interest offered by two finance companies P and Q over the years.
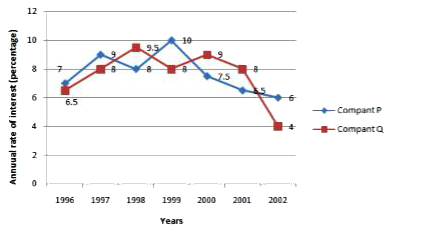
A sum of Rs. 3.5 lakhs was invested in company Q in the year 2000 for one year. How much more simple interest will accrue if the amount was invested in company P?ARs. 5,500BRs. 5,000CRs. 5,200DRs. 5,250Two different finance companies declare a fixed annual rate of interest on the amount invested by investors with them. The interest rate declared by these companies can vary from year to year depending on the variation in the country's economy and the interest rate of the banks. The annual rate of interest offered by the two companies P and Q is shown in the graph below. Study the graph and answer the question.
Annual percentage rate of interest offered by two finance companies P and Q over the years.
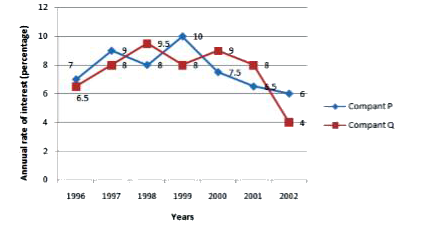
An investor invested a sum of ₹4 lakhs in company in the year 2000. After one year, the entire amount was transferred to company P in 2001 as an investment for one year. What amount will the investor receive from company P?ARs. 4,54,420BRs. 4,64,340CRs. 4,64,430DRs. 4,56,320Study the following line graph and answer the questions.
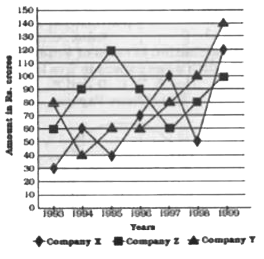
In which year was the difference between the exports of companies Y and Z maximum ?A1994B1997C1995D1996
Read the following graph carfully and answer the questions given below. Production of bulbs by different companies in three years (In lakhs)
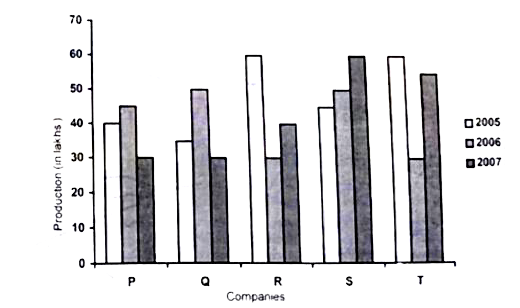
What is the ratio of average production of company Q to the average production of company T in all the given years?
View SolutionReading of line graphs containing the profit earned in different year by two company
View SolutionFollowing graph shows the income of a company in six different years. Study the graph , carefully and answer the questions that follow.
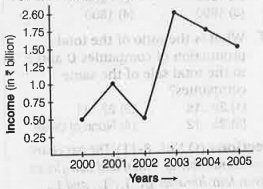
In which year income of the company is the highest?
View SolutionFollowing graph shows the income of a company in six different years. Study the graph , carefully and answer the questions that follow.
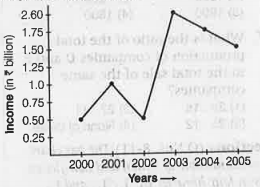
What is the ratio of the income of the company in the years 2000 and 2005 ?
View SolutionStudy the following graph carefully and answer the given questions :-
The following graph shows the % profit of two companies over the years :-
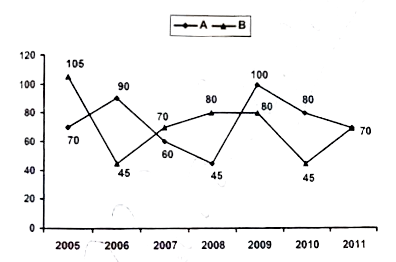
In which of the following years was the total income more than double the total expenditure in that year for company A ?
View Solution
