तालिका में विभिन्न प्रकार की कारो के उत्पादन को (हजारो में) दर्शाया गया है।
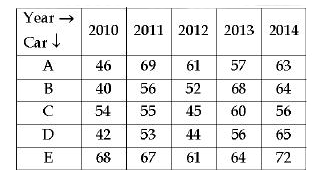
2011 में टाइप B तथा 2018 में टाइप E कारो के कुल उत्पादन का 2014 में टाइप C तथा 2012 में टाइप D के कुल उत्पादन से अनुपात है
8:9
6:5
5:6
16:11
The correct Answer is:B
Step by step video, text & image solution for तालिका में विभिन्न प्रकार की कारो के उत्पादन को (हजारो में) दर्शाया गया है। 2011 में टाइप B तथा 2018 में टाइप E कारो के कुल उत्पादन का 2014 में टाइप C तथा 2012 में टाइप D के कुल उत्पादन से अनुपात है by Maths experts to help you in doubts & scoring excellent marks in Class 14 exams.
Topper's Solved these Questions
Similar Questions
यदि A:B=2:3 और B:C=3:7, तो A+B:B+C:C+A क्या होगा?
01:49View SolutionP और Q की वर्तमान आयु के बीच का क्रमशः अनुपात 3 : 4 है। चार वर्ष बाद Q, P से पाँच वर्ष बड़ा होगा।P की वर्तमान आयु कितनी है?
01:31View SolutionThe bar graph shows the exports of Cars of Type A and B (in Rs. million).
दिए गए दंड आरेख में टाइप A और B कारो के निर्यात को दर्शाया गया है (मिलियन रु. में)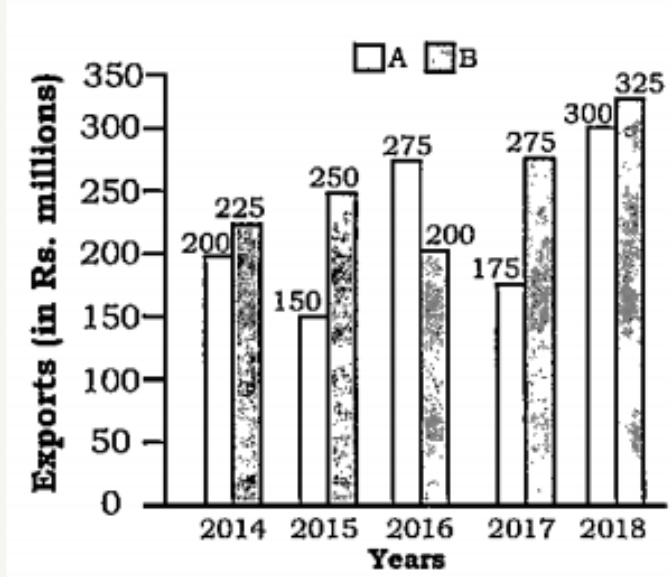 What is the ratio of the exports of cars of Type A in 2014 and 2018 to the total exports of cars of type B in 2015 and 2016?
2014 और 2018 में टाइप A कारो के कुल निर्यात और 2015 और 2016 में टाइप B कारो के कुल निर्यात का अनुपात क्या हे?01:50View SolutionThe table shows the production of different types of cars (in thousands). यह तालिका अलग-अलग प्रकार के कारों का उत्पादन ( हज़ार में) दर्शाती है | What is the ratio of the total production of cars of type A in 2014 and type C in 2013 taken together to the total production of cars of type B in 2016 and type E in 2015 taken together? 2014 में A प्रकार की कारों और 2013 में C प्रकार की कारों के कु ल उत्पादन का 2016 में B प्रकार की कारों और 2015 में E प्रकार की कारों के कुल उत्पादन के साथ अनुपात ज्ञात करें |
02:22View SolutionThe table shows the production of different types of cars (in thousands)
यह तालिका अलग-अलग प्रकार के कारों का उत्पादन ( हज़ार में ) दर्शाती है |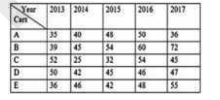 The ratio of the total production of cars of type C and E taken together in 2013 to the total production of cars of type D in 2014 and 2016 and type E in 2017 taken together is:
2013 में C और E प्रकार की कारों के कुल उत्पादन का 2014 और 2016 में D तथा 2017 में E प्रकार की कारों के कुल उत्पादन के साथ अनुपात ज्ञात करें |01:35View SolutionThe table shows the production of different types of cars (in thousands)
यह तालिका अलग-अलग प्रकार के कारों का उत्पादन ( हज़ार में ) दर्शाती है |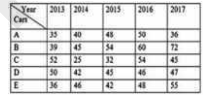 The production of cars of type A in 2015 and of type C in 2013 taken together is approximately what percent of the total production of cars of type D in five years?
2015 में A प्रकार की कारों का उत्पादन तथा 2013 में C प्रकार की कारों के उत्पादन को मिला दिया जाए, तो ये पांच वर्षों में D प्रकार की कारों के कुल उत्पादन का लगभग कितना प्रतिशत है ?03:10View SolutionThe table shows the production of different types of cars (in thousands).
 The ratio of the total production of type A cars in 2015 ana type B cars in 2014 taken together to the total production of type C cars in 2017 and type E cars in 2018 taken together is:
2015 में A प्रकार की कारों के उत्पादन और 2014 में B प्रकार की कारों के उत्पादन को मिलाकर इनका अनुपात संयुक्त रूप से 2017 में C प्रकार तथा 2018 में E प्रकार की कारों के उत्पादन के साथ ज्ञात करें |01:51View SolutionThe table shows the production of different types of cars (in thousands).
 The total production of type C cars in 2015 and type E cars in 2018 taken together is what percent of the total production of cars in 2014 and 2017 taken together?
2015 में C तथा 2018 में E प्रकार की कारों का कुल उत्पादन एक साथ 2014 तथा 2017 में कारों के कुल उत्पादन का कितना प्रतिशत है ?01:47View SolutionThe table shows the production of different types of cars (in thousands).
यह तालिका एक कंपनी द्वारा 5 वर्षों में अलग-अलग कारों के उत्पादन (हज़ार में ) को दर्शाती है | What is the ratio of the total production of type E cars in 2014 and type C cars in 2016 taken together to the total production of type B cars in 2014 and type D cars in 2013 taken together?
2014 में E प्रकार तथा 2016 में C प्रकार की कारों के कुल उत्पादन का 2014 में B प्रकार तथा 2013 में D प्रकार की कारों के कुल उत्पादन के साथ अनुपात ज्ञात करें |02:15View SolutionThe table shows the production of different types of cars (in thousands).
यह तालिका एक कंपनी द्वारा अलग-अलग कारों के उत्पादन ( हज़ार में ) को दर्शाती है |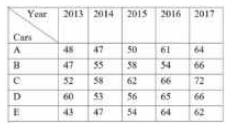 The total production of type B cars in 2015 and type C cars in 2013 is what percent more than the total production of type E cars in 2013 and 2014 ? (Correct to one decimal place)
2015 में B प्रकार तथा 2013 में प्रकार की कारों का कुल उत्पादन 2013 तथा 2014 में E प्रकार की कारों के कुल उत्पादन से कितना प्रतिशत अधिक है ? (एक दशमलव स्थान तक)02:10View SolutionThe table shows the production of different types of cars (in thousands).
यह तालिका एक कंपनी द्वारा अलग-अलग कारों के उत्पादन ( हज़ार में ) को दर्शाती है |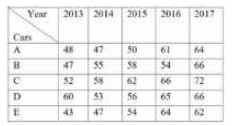 The ratio of the total production of type A cars in 2017 and type D cars in 2015 to the total production of type B and type E cars in 2013 is:
2017 में A प्रकार तथा 2015 में प्रकार की कारों के कुल उत्पादन का 2013 में B और E प्रकार की कारों के कुल उत्पादन के साथ अनुपात ज्ञात करें |03:01View SolutionThe table shows the production of different types of cars (in thousands).
यह तालिका एक कंपनी द्वारा अलग-अलग कारों के उत्पादन ( हज़ार में ) को दर्शाती है |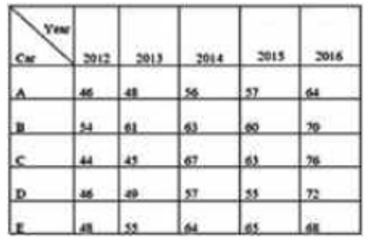 The average production of type C cars during 2012 to 2016 is approximately what percent less than the total production of type D cars in 2012 and type E cars in 2014?
2012 से 2016 के दौरान C प्रकार की कारों का औसत उत्पादन 2012 में D प्रकार एवं 2014 में E प्रकार की कारों के कुल उत्पादन से लगभग कितना प्रतिशत कम है ?01:48View SolutionThe table shows the production of different types of cars (in thousands).
यह तालिका एक कंपनी द्वारा अलग-अलग कारों के उत्पादन ( हज़ार में ) को दर्शाती है |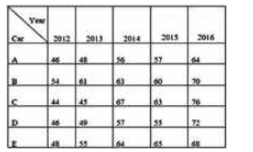 The ratio of the total production of type A cars in 2014 and 2016 and type C cars in 2013 taken together to the total production of type B cars and type D cars taken together in 2014 is:
2014 तथा 2016 में A प्रकार एवं 2013 में C प्रकार की कारों के कुल उत्पादन ( संयुक्त रूप से ) का 2014 में B प्रकार और D प्रकार की कारों के कुल उत्पादन के साथ अनुपात ज्ञात करें |03:25View SolutionThe table shows the production of different types of cars (in thousands).
यह तालिका एक कंपनी द्वारा अलग-अलग कारों के उत्पादन (हज़ार में ) को दर्शाती है |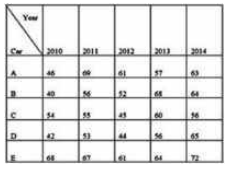 What is the ratio of the total production of type B cars in 2011 and type E cars in 2013 taken together to the total production of type C cars in 2014 and type D cars in 2012 taken together?
2011 में B प्रकार एवं 2013 में E प्रकार की कारों के कुल उत्पादन ( संयुक्त रूप से ) का 2014 में C प्रकार और 2012 में D प्रकार की कारों के कुल उत्पादन के साथ अनुपात ज्ञात करें |01:47View SolutionThe table shows the production of different types of cars (in thousands).
यह तालिका एक कंपनी द्वारा अलग-अलग कारों के उत्पादन (हज़ार में ) को दर्शाती है |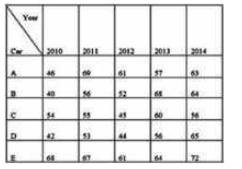 The average production of all type of cars in 2014 is approximately what percent less than the total production of type B cars in 2013 and type D cars in
2010 taken together?
2014 में सभी प्रकार की कारों का औसत उत्पादन 2013 में B प्रकार तथा 2010 में D प्रकार की कारों के कुल उत्पादन से लगभग कितना प्रतिशत कम है ?03:13View SolutionThe table shows the production of different types of cars (in thousands).
यह तालिका एक कंपनी द्वारा अलग-अलग कारों के उत्पादन (हज़ार में ) को दर्शाती है |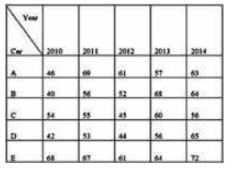 The total production of type A cars in 2011, and type C cars and type E cars in 2012 taken together
is what percent of the total production of type B cars during 2010 to 2014?
2011 में A प्रकार की कारों तथा 2012 में C प्रकार एवं E प्रकार की कारों का कुल उत्पादन ( सब को मिलाकर ) 2010 से 2014 के दौरान B प्रकार की कारों के कुल उत्पादन का कितना प्रतिशत है ?03:15View Solution

