B की बिक्री तथा A और C की संयुक्त बिक्री के अनुपात को महीने के अनुसार, आरोही कर्म में व्यवस्थित कीजिये
जनवरी, फरवरी, मार्च, अप्रैल
जनवरी, अप्रैल, मार्च, फरवरी
जनवरी, मार्च, अप्रैल, फरवरी
जनवरी, मार्च, फरवरी, अप्रैल
The correct Answer is:B
Step by step video, text & image solution for B की बिक्री तथा A और C की संयुक्त बिक्री के अनुपात को महीने के अनुसार, आरोही कर्म में व्यवस्थित कीजिये by Maths experts to help you in doubts & scoring excellent marks in Class 14 exams.
Updated on:21/07/2023Topper's Solved these Questions
Similar Questions
यदि A:B=2:3 और B:C=3:7, तो A+B:B+C:C+A क्या होगा?
View SolutionP और Q की वर्तमान आयु के बीच का क्रमशः अनुपात 3 : 4 है। चार वर्ष बाद Q, P से पाँच वर्ष बड़ा होगा।P की वर्तमान आयु कितनी है?
View Solutionरेखाओ y=mx+c तथाxa+yb=1 को xcosα+ysinα=p के रूप में लिखिए की लंब की लम्बाई ज्ञात कीजिये ।
View Solutione7x+e3xe5x को x की घातों के आरोही क्रम में लिखिय|
View Solutionअपनी पुरानी साइकिल की बिक्री के लिए 50 शब्दों में एक आकर्षक विज्ञापन तैयार कीजिए।
View SolutionThe table below shows the sales of milk in six different states as a percentage of total sales. In each state only two milkmen A and B sell the milk. The table below shows the sales of salesman A as percentage of total sale of milk in each state. The total sales of milk is 200000 litres.
नीचे दी गईं तालिका में छः विभिन्न राज्यों में दूध की कुल बिक्री को प्रतिशत में दर्शाया गया है। प्रत्येक राज्य में केवल दो दूध विक्रेता A तथा B दूध बेचते है। नीचे दी गई तालिका प्रत्येक राज्य में दूध की कुल बिक्री के प्रतिशत में विक्रेता A दवारा की गई बिक्री को दर्शाती है। दूध की कुल बिक्री 200000 लीटर है।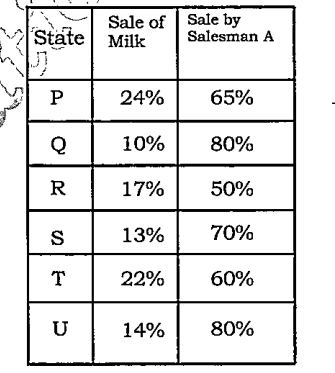 What is the respective ratio of
sales of milk in state P and Q by salesmen B and the sales of milk in state R and T by salesmen A?
राज्य P तथा Q में विक्रेता B द्वारा की गई दूध की बिक्री तथा राज्य R तथा T में विक्रेता A द्वारा की गई दूध की बिक्री का क्रमशः अनुपात क्या है?
View SolutionThe table below shows the sales of milk in six different states as a percentage of total sales. In each state only two milkmen A and B sell the milk. The table below shows the sales of salesman A as percentage of total sale of milk in each state. The total sales of milk is 200000 litres.
नीचे दी गईं तालिका में छः विभिन्न राज्यों में दूध की कुल बिक्री को प्रतिशत में दर्शाया गया है। प्रत्येक राज्य में केवल दो दूध विक्रेता A तथा B दूध बेचते है। नीचे दी गई तालिका प्रत्येक राज्य में दूध की कुल बिक्री के प्रतिशत में विक्रेता A दवारा की गई बिक्री को दर्शाती है। दूध की कुल बिक्री 200000 लीटर है।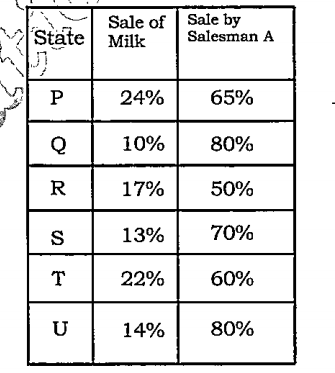 What will be difference (in litres) in the sale of milk in state T by
salesmen B and the total sale of milk in state R and S together?
राज्य T में विक्रेता B द्वारा की गई दूध की बिक्री तथा राज्य R तथा S में मिलाकर हुई दूध की कूल बिक्री में क्या अंतर (लीटर में) है?
View SolutionThe table below shows the sales of milk in six different states as a percentage of total sales. In each state only two milkmen A and B sell the milk. The table below shows the sales of salesman A as percentage of total sale of milk in each state. The total sales of milk is 200000 litres.
नीचे दी गईं तालिका में छः विभिन्न राज्यों में दूध की कुल बिक्री को प्रतिशत में दर्शाया गया है। प्रत्येक राज्य में केवल दो दूध विक्रेता A तथा B दूध बेचते है। नीचे दी गई तालिका प्रत्येक राज्य में दूध की कुल बिक्री के प्रतिशत में विक्रेता A दवारा की गई बिक्री को दर्शाती है। दूध की कुल बिक्री 200000 लीटर है।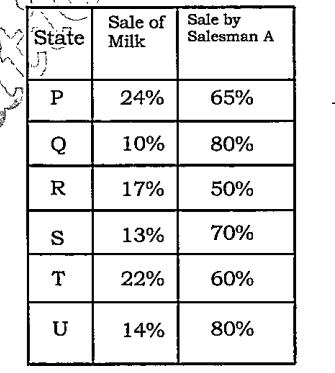 What is the difference (in litres) between the sale of milk in state R by salesmen A and the sale of milk in the same state by the salesmen B?
राज्य R में विक्रेता A द्वारा की गई दूध की बिक्री तथा समान राज्य में विक्रेता B द्वारा की गई दूध की बिक्री में क्या अंतर (लीटर मे) है?
View SolutionThe following line diagram represents the yearly sales figure of a company in the years 2001-2010. Examine the diagram and answer the question. निम्नलिखित रेखा आरेख किसी कंपनी की वर्ष 2007-2010 के दौरान वार्षिक बिक्री के आंकड़ों को दर्शाता है। आरेख का अध्ययन करें और नीचे दिए गए प्रश्नों के उत्तर दें- The ratio of sales in 2002 to that in 2007 is वर्ष 2002 में बिक्री का वर्ष 2007 में बिक्री के साथ अनुपात है-
View SolutionA started a business with a capital of Rs. 54000 and admitted B and C after 4 months and 6 months respectively. At the end of the year, the profit was divided in the ratio 1:4:5. What is the difference between the capitals invested by B and C ?
A ने 54000 रुपये की पूँजी से एक व्यवसाय की शुरुआत की तथा क्रमशः चार और छः महीने बाद B एवं C को शामिल कर लिया | वर्ष के अंत में लाभों का वितरण 1:4:5 के अनुपात में किया गया | B और C के द्वारा लगाई गयी पूँजी में क्या अंतर है?
View SolutionA sum of Rs. 5200 is divided amongst A, B, C and D such that the ratio of shares of A and B is 2:3, that of B and C is 4:5 and that of C and D is 1:2. What is the difference between the shares of B and D?
5200 रुपये की राशि A, B, C और D में इस प्रकार विभाजित की जाती है कि A और B के हिस्सों का अनुपात 2: 3 है, B और C के हिस्सों का अनुपात 4 : 5 है तथा C और D के हिस्सों का अनुपात 1 : 2 है | B और D के हिस्सों में क्या अंतर है ?
View SolutionThe line graph shows the production of product A and B (in thousands) during the period 2004 to 2009 and the second line Graph shows the percentage sale of these products.
यह पंक्ति आलेख 2004 से 2009 की अवधि के दौरान वस्तु A एवं B के उत्पादन ( हज़ार में ) को दर्शाता है तथा दूसरा पंक्ति आलेख इन वस्तुओं की प्रतिशत बिक्री को दर्शाता है |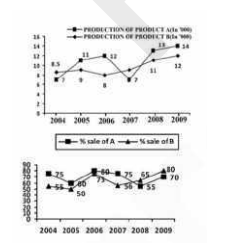 In the given line graph, what is the total sale of Product B in the year 2004 and 2008 together?
दिए गए पंक्ति आलेख के अनुसार, वर्ष 2004 एवं 2008 को मिलाकर वस्तु B की कुल बिक्री ज्ञात करें |
View SolutionThe line graph shows the production of product A and B (in thousands) during the period 2004 to 2009 and the second line Graph shows the percentage sale of these products.
यह पंक्ति आलेख 2004 से 2009 की अवधि के दौरान वस्तु A एवं B के उत्पादन ( हज़ार में ) को दर्शाता है तथा दूसरा पंक्ति आलेख इन वस्तुओं की प्रतिशत बिक्री को दर्शाता है |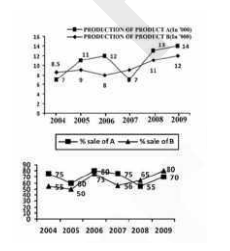 In the given line graph, what is the total sale of Product A in the year 2005 and 2009 taken together?
दिए गए पंक्ति आलेख के अनुसार, वर्ष 2005 तथा 2009 को मिलाकर वस्तु A की कुल बिक्री कितनी है ?
View SolutionThe given Bar Graph presents the sale (in 1000 kg) of a particular brand of tea by three outlets. A, B and C during the months feb, Mar and Apr,2018 दिया गया दंड आरेख तीन आउटलेट A, B और C के द्वारा तीन महीनों : फरवरी, मार्च और अप्रैल 2018 में एक विशेष ब्रांड की चाय की बिक्री ( हज़ार किलो ग्राम में ) को दर्शाता है | What is the ratio of rate of growth in sales from B to the rate of growth in sales from C in Mar 2018 with reference to its previous month? पिछले माह की तुलना में मार्च 2018 में B की बिक्री में वृद्धि का C की बिक्री में वृद्धि के साथ अनुपात ज्ञात करें |
View SolutionThe given bar graph shows the production and sale of mobile handsets of six different companies A, B, C, D, E, & F during the period of one month. With respect to production, the sale percentage of which company is highest ? दंड आरेख विभिन्न कंपनियों A, B, C, D, E & F की एक माह में मोबाइल हैंडसेट के उत्पादन और बिक्री को दर्शाता है | किस कंपनी की बिक्री का प्रतिशत, उसके उत्पादन के संदर्भ में, सबसे अधिक है ?
View SolutionThe following graph shows the sales of cars (in thousands) in four cities in 4 years. Study the graph and answer the questions.
निम्नलिखित आरेख 4 वर्षों में चार शहरों में कारों की बिक्री (हज़ार में) को दर्शाता है। इस आरेख का अध्ययन कीजिए तथा प्रश्नों के उत्तर दीजिए। Which city has the highest percentage of sales, and in which year?
किस शहर की बिक्री का प्रतिशत सबसे अधिक है तथा किस वर्ष में?
View Solution
