वर्ष 2012, 2013 और 2016 के दौरान लेखकों को भुगतान किये गए स्वत्व शुल्क (रॉयल्टी) की कुल राशि (Rs में) कितनी है ?
316000
273100
272000
271600
The correct Answer is:A
Topper's Solved these Questions
Similar Questions
यदि A:B=2:3 और B:C=3:7, तो A+B:B+C:C+A क्या होगा?
View SolutionP और Q की वर्तमान आयु के बीच का क्रमशः अनुपात 3 : 4 है। चार वर्ष बाद Q, P से पाँच वर्ष बड़ा होगा।P की वर्तमान आयु कितनी है?
View SolutionThe following line diagram represents the yearly sales figure of a company in the years 2001-2010. Examine the diagram and answer the question. निम्नलिखित रेखा आरेख किसी कंपनी की वर्ष 2007-2010 के दौरान वार्षिक बिक्री के आंकड़ों को दर्शाता है। आरेख का अध्ययन करें और नीचे दिए गए प्रश्नों के उत्तर दें- ............................................................................................................................................. Total sales (in crore of Rs.) from 2005 to 2008 is वर्ष 2005 से वर्ष 2008 तक कुल बिक्री (रु. करोड में) है-
View SolutionThe annual interest compounded on any amount is Rs 1,320 for the second year and Rs 1,452 for the third year. What will be the original amount at the beginning of the first year?
किसी राशि पर वार्षिक संयोजित चक्रवृद्धि ब्याज दूसरे वर्ष के लिए Rs 1,320 है और तीसरे वर्ष के लिए Rs 1,452 है | पहले वर्ष की शुरुआत में मूल राशि कितनी होगी ?
View SolutionThe given bar graph shows the imports and exports (in Rs crores) of steel by a country from 2013 to 2017.
दिया गया दंड आरेख एक देश के द्वारा 2013 से 2017 तक इस्पात के आयात और निर्यात ( करोड़ रुपये में) को दर्शाता है |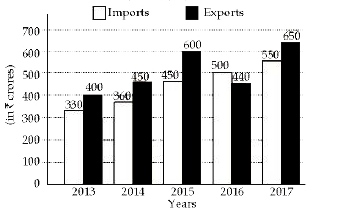 What is the ratio of the total imports in 2015 and 2017 to the total exports in 2013 and 2016 ?
2015 तथा 2017 में किये गए कुल आयात का 2013 तथा 2016 में किये गए कुल निर्यात के साथ अनुपात ज्ञात करें|
View SolutionThe table shows the production of different types of cars (in thousands).
यह तालिका एक कंपनी द्वारा 5 वर्षों में अलग-अलग कारों के उत्पादन (हज़ार में ) को दर्शाती है | The total production of type E cars in 2012 and 2013 is approximately what percent more than the average production of type A cars during the years 2012 to 2016?
2012 और 2013 में E प्रकार की कारों का कुल उत्पादन 2012 से 2016 के दौरान A प्रकार की कारों के औसत उत्पादन से लगभग कितना प्रतिशत अधिक है ?
View SolutionThe table shows the production of different types of cars (in thousands).
यह तालिका एक कंपनी द्वारा अलग-अलग कारों के उत्पादन ( हज़ार में ) को दर्शाती है |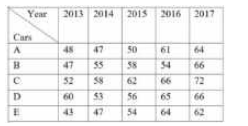 The total production of type B cars during 2013 to 2016 is approximately what percent less than the total production of cars in 2017?
2013 से 2016 के दौरान B प्रकार की कारों का कुल उत्पादन 2017 में कारों के कुल उत्पादन से लगभग कितना प्रतिशत कम है ?
View SolutionThe given Bar Graph presents the number of students of two schools for six years. दिया गया दंड आरेख छः वर्ष की अवधि में दो विद्यालयों में छात्रों की संख्या को दर्शाता है | What is the ratio of the number of students taken together for the years 2008, 2012 and 2013 in School A to the number of students taken together for the years 2008, 2012 and 2013 in school B? विद्यालय A में 2008, 2012 तथा 2013 को मिलाकर छात्रों की संख्या का विद्यालय B में 2008, 2012 तथा 2013 को मिलाकर होने वाले छात्रों की संख्या के साथ अनुपात ज्ञात करें |
View SolutionThe given Bar Graph presents the data of annual income (A) and annual expenditure (B) of an IT officer in a multi-national company during the years 2012 to 2016. दिया गया दंड आरेख वर्ष 2012 से 2016 के दौरान किसी बहुराष्ट्रीय कंपनी में कार्यरत एक आईटी अधिकारी अधिकारी की वार्षिक आय ( A ) और वार्षिक व्यय (B) के आंकड़ों को दर्शाता है | What was his average monthly savings (in Rs) in 2015 and 2016, taken together (correct to two decimal places)? 2015 और 2016 को मिलाकर उसकी औसत मासिक बचत ( रुपये में ) कितनी थी ? ( दशमलव के दो स्थान तक )
View SolutionThe given Bar Graph presents the data of annual income (A) and annual expenditure (B) of an IT officer in a multi-national company during the years 2012 to 2016. दिया गया दंड आरेख वर्ष 2012 से 2016 के दौरान किसी बहुराष्ट्रीय कंपनी में कार्यरत एक आईटी अधिकारी अधिकारी की वार्षिक आय ( A ) और वार्षिक व्यय (B) के आंकड़ों को दर्शाता है | What is the what is the percentage of his total savings with reference to his total income for the period 2012-15? 2012 से 2015 की अवधि में उसकी कुल आय के संदर्भ में उसकी कुल बचत का प्रतिशत कितना है ?
View SolutionThe given Bar Graph presents the data of annual income (A) and annual expenditure (B) of an IT officer in a multi-national company during the years 2012 to 2016. दिया गया दंड आरेख वर्ष 2012 से 2016 के दौरान किसी बहुराष्ट्रीय कंपनी में कार्यरत एक आईटी अधिकारी अधिकारी की वार्षिक आय ( A ) और वार्षिक व्यय (B) के आंकड़ों को दर्शाता है | What is the ratio between the ratios of savings to expenditure, respectively for the periods 2012-13 and 2015-16? बचत और व्यय के अनुपात के बीच क्रमशः वर्ष 2012-13 और 2015-16 के लिए अनुपात ज्ञात करें |
View SolutionThe given Bar Graph presents the Export of Tea and Coffee (in million kg) for the years 2012 to 2016. What is the ratio of total export of tea in 2012, 2014 and 2015 to the total export of coffee in 2013 and 2014?
दिया गया दंड आरेख वर्ष 2012 से 2016 के दौरान चाय और कॉफ़ी के निर्यात ( मिलियन किलो ग्राम में ) को दर्शाता है |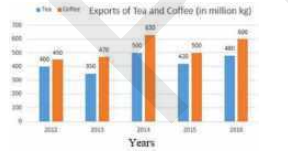
2012, 2014 और 2015 में चाय के कुल निर्यात का 2013 और 2014 में कॉफ़ी के कुल निर्यात के साथ अनुपात ज्ञात करें |
View SolutionThe given Bar Graph presents the Export of Tea and Coffee (in million kg) for the years 2012 to 2016.
दिया गया दंड आरेख वर्ष 2012 से 2016 के दौरान चाय और कॉफ़ी के निर्यात ( मिलियन किलो ग्राम में ) को दर्शाता है |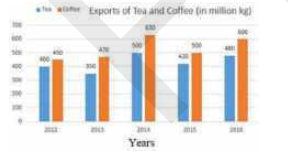
The number of years, in each of which the export of coffee is more than 20% as compared to the export of tea in that year is:
ऐसे कितने वर्ष हैं जिनमें से प्रत्येक में कॉफ़ी का निर्यात इस वर्ष में चाय के निर्यात की तुलना में 20% अधिक है ?
View SolutionThe Pie-chart given here shows the percentage of candidates selected in an examination from 2012 to 2016.
यहाँ दिया गया वृत्त आरेख 2012 से 2016 तक किसी परीक्षा में चयनित उम्मीदवारों के प्रतिशत को दर्शाता है |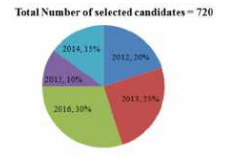 In which year the number of selected candidates is equal to the total number of selected candidates in 2012 and 2015 taken together ?
किस वर्ष में चयनित उम्मीदवारों की संख्या, वर्ष 2012 तथा 2015 को एक साथ मिलाकर चयनित उम्मीदवारों की कुल संख्या के बराबर है ?
View SolutionThe Pie-chart given here shows the percentage of candidates selected in an examination from 2012 to 2016.
यहाँ दिया गया वृत्त आरेख 2012 से 2016 तक किसी परीक्षा में चयनित उम्मीदवारों के प्रतिशत को दर्शाता है |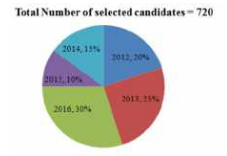 Total candidates selected in 2015 is what percentage less than the total candidates selected in 2013?
2015 में चयनित कुल उम्मीदवार, 2013 में चयनित कुल उम्मीदवारों से कितने प्रतिशत कम है ?
View SolutionThe bar graph given below shows the target and actual production of cement ( in thousand tons ) during 2013-2017. The ratio of the target production in 2014 and 2016 to the actual total production in 2013, 2016 and 2017 is :
नीचे दिया गया दंड आरेख 2013-2017 के दौरान सीमेंट के लक्षित और वास्तविक उत्पादन (हजार टन में) को दर्शाता है |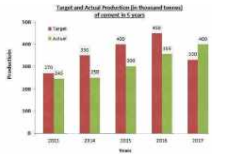
वर्ष 2014 और 2016 में सीमेंट के कुल लक्षित उत्पादन और 2013, 2016 तथा 2017 में कुल वास्तविक उत्पादन का अनुपात है :
View Solution
