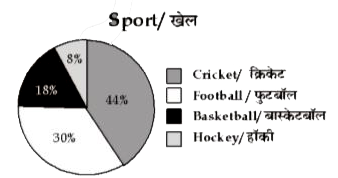
दिए गए पाई-चार्ट में एक स्कूल के छात्र का पसंदीदा खेल दिखाया गया है।

दिए गए पाई-चार्ट में, यदि सभी खेलो में कुल 1280 छात्र थे, तो कितने को फुटबॉल पसंद था ?
102
550
230
384
The correct Answer is:D
Topper's Solved these Questions
Similar Questions
यदि A:B=2:3 और B:C=3:7, तो A+B:B+C:C+A क्या होगा?
View SolutionP और Q की वर्तमान आयु के बीच का क्रमशः अनुपात 3 : 4 है। चार वर्ष बाद Q, P से पाँच वर्ष बड़ा होगा।P की वर्तमान आयु कितनी है?
View SolutionDetermine the point of symmetry of a regular hexagon.
View SolutionMatch the following Column A to Column B

View SolutionMatch the following Column A to Column B

View SolutionMatch the following Column A to Column B

View SolutionThe inequation represented by the graph given below is :
View SolutionThe inequation that best describes the graph given below is _________
View SolutionThe inequation that best describes the following graph is _________
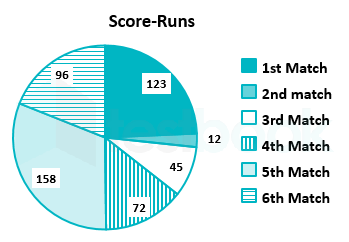
View SolutionThe given pie chart shows runs scored by A in 6 matches.
दिया गया पाई चार्ट A के द्वारा 6 मैचों में बनाए गए रनों को दर्शाता है | In the given pie-chart, if A scored a century in matches 4 and 6, what would have been her average score? /
इस पाई चार्ट में यदि A ने चौथे और छठे मैच में शतक लगाया होता तो उसका औसत स्कोर क्या रहता ?
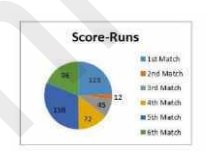
View SolutionThe given pie chart shows runs scored by A in 6 matches.
दिया गया पाई चार्ट A के द्वारा 6 मैचों में बनाए गए रनों को दर्शाता है | In the given pie-chart, what is the increase or decrease in score in match 4 as compared to match 2?
/ इस पाई चार्ट में मैच 2 की तुलना में मैच 4 के स्कोर में कितनी वृद्धि या कमी हुई है ?
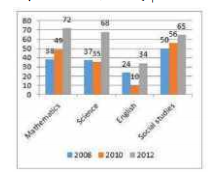
View SolutionThe given bar graph shows the number of marks scored by a student in each subject in three years.
दिया गया दंड आरेख एक छात्र के द्वारा तीन वर्षो में प्रत्येक विषय में लाये गए अंकों को दर्शाता है | In the given chart, the number of marks in social studies in 2012 is 13% of the school strength. The number of students is:
दिए गए चार्ट में, यदि वर्ष 2012 में सामाजिक अध्ययन में अंकों की संख्या स्कूल की के छात्रों की संख्या का 13% है। छात्रों की संख्या कितनी है?
View SolutionIn the given pie-chart, if the female employees in department D is 75%, then how many male employees are in that department? दिए गए पाई चार्ट में, यदि विभाग D में महिला कर्मचारी 75% हैं, तो उस विभाग में कितने पुरुष कर्मचारी हैं ?
View SolutionThe given pie-chart depicts the percentage of students coming to school using different modes of transport. Total number of students=1300 दिया गया पाई चार्ट परिवहन के विभिन्न साधनों का प्रयोग करके विद्यालय आने वाले छात्रों का प्रतिशत दर्शाता है | छात्रों की कुल संख्या =1300 In the given pie-chart, if 234 students used to walk, then how many come by bus ? / दिए गए पाई-चार्ट में, यदि 234 छात्र चलकर आते हैं, तो कितने छात्र बस से आते हैं?
View SolutionThe given pie-chart favourite sport of students of a school. दिया गया पाई चार्ट एक विद्यालय के छात्रों के पसंदीदा खेल को दर्शाता है | In the given pie-chart, if there were 1280 students in all, how many liked football? इस पाई चार्ट के अनुसार, यदि कुल मिलाकर 1280 छात्र हैं, तो फुटबॉल कितने छात्रों को पसंद है ?
View SolutionThe given pie-chart favourite sport of students of a school. दिया गया पाई चार्ट एक विद्यालय के छात्रों के पसंदीदा खेल को दर्शाता है | In the given pie-chart, what is the difference in percentage between liking for football and basketball? इस पाई चार्ट के अनुसार, फुटबॉल तथा बास्केटबॉल पसंद करने के प्रतिशत में क्या अंतर है ?
View Solution
