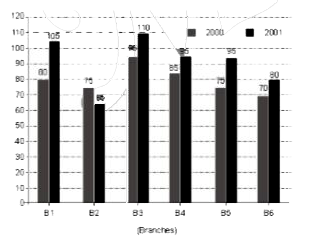
दिए गए बार ग्राफ में किताबो की बिक्री छ ब्राचो के लिए दर्शायी गई है, 2000 व 2001 के लिए।

सभी ब्रांचो की 2000 से वर्ष 2001 की बिक्री का अनुपात ज्ञात कीजिये ?
(1)45:58
(2)55:48
(3)7:11
(4)48:55
The correct Answer is:D
Step by step video, text & image solution for दिए गए बार ग्राफ में किताबो की बिक्री छ ब्राचो के लिए दर्शायी गई है, 2000 व 2001 के लिए। सभी ब्रांचो की 2000 से वर्ष 2001 की बिक्री का अनुपात ज्ञात कीजिये ? by Maths experts to help you in doubts & scoring excellent marks in Class 14 exams.
Updated on:21/07/2023Topper's Solved these Questions
Similar Questions
यदि A:B=2:3 और B:C=3:7, तो A+B:B+C:C+A क्या होगा?
View SolutionP और Q की वर्तमान आयु के बीच का क्रमशः अनुपात 3 : 4 है। चार वर्ष बाद Q, P से पाँच वर्ष बड़ा होगा।P की वर्तमान आयु कितनी है?
View SolutionDetermine the point of symmetry of a regular hexagon.
View SolutionMatch the following Column A to Column B

View SolutionMatch the following Column A to Column B

View SolutionMatch the following Column A to Column B

View SolutionThe inequation represented by the graph given below is :
View SolutionThe inequation that best describes the graph given below is _________
View SolutionThe inequation that best describes the following graph is _________
View Solutionअपनी पुरानी साइकिल की बिक्री के लिए 50 शब्दों में एक आकर्षक विज्ञापन तैयार कीजिए।
View SolutionThe following line diagram represents the yearly sales figure of a company in the years 2001-2010. Examine the diagram and answer the question. निम्नलिखित रेखा आरेख किसी कंपनी की वर्ष 2007-2010 के दौरान वार्षिक बिक्री के आंकड़ों को दर्शाता है। आरेख का अध्ययन करें और नीचे दिए गए प्रश्नों के उत्तर दें- By what percent did the sales in 2008 decrease in comparison to the sales in 2006? वर्ष 2006 में बिक्री की तुलना में वर्ष 2008 में बिक्रो में कितने प्रतिशत की कमी आई?
View SolutionThe following line diagram represents the yearly sales figure of a company in the years 2001-2010. Examine the diagram and answer the question. निम्नलिखित रेखा आरेख किसी कंपनी की वर्ष 2007-2010 के दौरान वार्षिक बिक्री के आंकड़ों को दर्शाता है। आरेख का अध्ययन करें और नीचे दिए गए प्रश्नों के उत्तर दें- The ratio of sales in 2002 to that in 2007 is वर्ष 2002 में बिक्री का वर्ष 2007 में बिक्री के साथ अनुपात है-
View SolutionThe following line diagram represents the yearly sales figure of a company in the years 2001-2010. Examine the diagram and answer the question. निम्नलिखित रेखा आरेख किसी कंपनी की वर्ष 2007-2010 के दौरान वार्षिक बिक्री के आंकड़ों को दर्शाता है। आरेख का अध्ययन करें और नीचे दिए गए प्रश्नों के उत्तर दें- The percentage increase in sales in the year 2005 with respect to the previous year is वर्ष 2005 में पिछले वर्ष की तुलना में बिक्री में वृद्धि का प्रतिशत है-
View SolutionThe following line diagram represents the yearly sales figure of a company in the years 2001-2010. Examine the diagram and answer the question. निम्नलिखित रेखा आरेख किसी कंपनी की वर्ष 2007-2010 के दौरान वार्षिक बिक्री के आंकड़ों को दर्शाता है। आरेख का अध्ययन करें और नीचे दिए गए प्रश्नों के उत्तर दें- ............................................................................................................................................. Total sales (in crore of Rs.) from 2005 to 2008 is वर्ष 2005 से वर्ष 2008 तक कुल बिक्री (रु. करोड में) है-
View SolutionThe given Bar Graph presents the sales of the number of books (in thousands) by six benches of a publishing company during two consecutive years 2000 and 2001. दिया गया दंड आरेख लगातार दो वर्षों : 2000 और 2001 में एक प्रकाशन कंपनी की छः शाखाओं के द्वारा बेची गयी पुस्तकों की संख्या ( हज़ार में ) दर्शाता है | The ratio of total sales by all branches for the year 2001 to total sales by all branches for the year 2000 is: वर्ष 2001 में सभी शाखाओं की कुल बिक्री का वर्ष 2000 में सभी शाखाओं की कुल बिक्री के साथ अनुपात ज्ञात करें|
View SolutionThe given bar graph shows the sale of books (in thousands) in four metropolitan branches of a company for the year 2014 and 2015. दिया गया बार ग्राफ वर्ष 2014 और 2015 के लिए किसी कंपनी की चार महानगरीय शाखाओं में पुस्तकों की (हज़ारो में ) बिक्री को दर्शाता है | In the given bar graph, compared to 2014, which of the branch saw maximum increase in sales (in%) in 2015? दिए गए बार ग्राफ में, 2014 की तुलना में 2015में कौन सी शाखा की बिक्री में अधिकतम वृद्धि (% में ) हुई ?
View Solution
