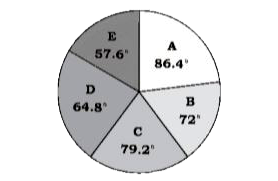
निम्न पाई-चार्ट का अध्ययन करे और उसके बाद दिए गए प्रश्न का उत्तर दे। एक शहर के पांच विद्यालयों (A, B, C, D और E) में विद्यार्थियों की संख्या का वितरण (अंश के अनुसार) दिए गए है।

यदि विद्यालय D और E विद्यार्थियों की कुल संख्या, विद्यालय A के विद्यार्थियों x अधिक है, तो x का मान किसके मध्य स्थित होगा ?
475 और 500
550 और 575
525और 550
500 और 525
The correct Answer is:D
Topper's Solved these Questions
Similar Questions
यदि A:B=2:3 और B:C=3:7, तो A+B:B+C:C+A क्या होगा?
View SolutionP और Q की वर्तमान आयु के बीच का क्रमशः अनुपात 3 : 4 है। चार वर्ष बाद Q, P से पाँच वर्ष बड़ा होगा।P की वर्तमान आयु कितनी है?
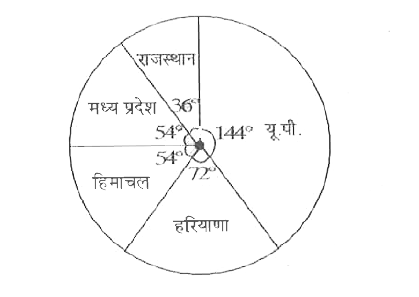
View Solutionचित्र में दिया गया वृत्त चार्ट मई -जून 2013 के दौरान वाहनों का केन्द्र्य सर्कार द्वारा चल्या गये अभियान में कटे हुए चलानो की संख्या को डिग्री (∘ ) में दर्शाता है। इसे ध्यानपूर्वक पढ़िए व निम्न प्रशनो के उत्तर दीजिए।
यदि कुल वाहनों 72 लाख है तो मध्य प्रदेश में कटे चालानों की संख्या राजस्थान के कटे चालानों की संख्या से कितना अधिक है ?

View Solutionदो अंको की एक संख्या में इकाई स्थान का अंक दहाई स्थान के अंक से 3 अधिक है यदि दोनों अंकों का जोड़ 11 हो तो संख्या निकालिए।
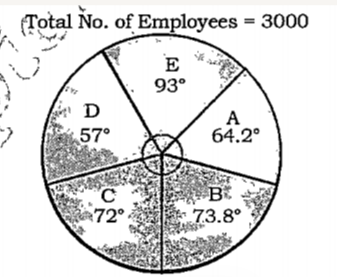
View SolutionStudy the given graph and answer the question that follows:

Breakup for distribution (degree wise) of the employees working in five departments (A,B,C,D, and E) in a company The number of employees in department B is what percent of the total number of employees working in department D and E?
दिए गए ग्राफ का अध्ययन करें और नीचे दिए गए प्रश्न का उत्त्तर दें। कंपनी के पांच विभागों (A, B, C, D और E) में काम कर रहे कर्मचारियों का वितरण
(डिग्री में) है। विभाग B में कर्मचारियों को संख्या, विभाग D और E में कार्य करने वाले कर्मचारियों की कुल संख्या की कितनी प्रतिशत है ?
View SolutionStudy the following bar graph and answer the questions given below. . The number of boys in school B is what percentage of the number of students in that school? निम्नांकित बार ग्राफ का अध्ययन कीजिए और उसके बाव दिए गए प्रश्न का उत्तर दीजिए। . स्कूल B में लड़कों की संख्या, उस स्कूल में विद्यार्थियों की कुल संख्या की कितने प्रतिशत है?
View SolutionStudy the following pie chart and table to answer the question.Total number of students admitted in a university in various fields = 5000 Distribution of the number of students into various fields: The ratio of the number of boys in Economics to the number of students in Economics is: निम्नांकित पाई चार्ट का अध्ययन कीजिए और उसके बाद दिए गए प्रशन का उत्तर दीजिए। एक विश्वविद्यालय में विभिन्न संकायों में प्रवेश लेने वाले विद्यार्थियों की संख्या 5000 है। विभिन्न संकायों में विद्यार्थियों को संख्या का बंटनः इकोनॉमिक्स में लड़कों की संख्या का, इकोनॉमिक्स में कुल विद्यार्थियों की संख्या से क्या अनुपात हे?
View SolutionStudy the following pie chart and table to answer the question.Total number of students admitted in a university in various fields = 5000 Distribution of the number of students into various fields: What is the average number of boys in CS, ECE and EEE fields? निम्नांकित पाई चार्ट का अध्ययन कीजिए और उसके बाद दिए गए प्रशन का उत्तर दीजिए। एक विश्वविद्यालय में विभिन्न संकायों में प्रवेश लेने वाले विद्यार्थियों की संख्या 5000 है। विभिन्न संकायों में विद्यार्थियों को संख्या का बंटनः CS, ECE और EEE संकायों में लड़कों की औसत संख्या कितनी है?
View SolutionStudy the following bar graph and answer the questions given below. निम्नांकित बार ग्राफ का अध्ययन कीजिए और उसके बाद दिए गए प्रशन का उत्तर दीजिए। Total number of boys and girls in schools A, B, C, D and E. स्कूलों A, B, C, D और E में लड़कों और लड़कियों की कुल संख्या। What is the difference between the number of girls in school A and the number of girls in school C? स्कूल A में लड़कियों कीं संख्या और स्कूल C में लड़कों की संख्या में कितना अंतर है?
View Solutionविद्यार्थियों की एक पंक्ति में , सोहन का स्थान दोनों मे से किसी भी किनारे से 9 वाँ है तब विद्यार्थियों की कुल संख्या होगी ?
View SolutionA certain sum is divided between A, B, C and D such that the ratio of the shares of A and B is 1 : 3, that of B and C is 2 : 5 and that of C and D is 2 : 3. If the difference between the shares of A and C is ₹3,510, then the share of D is :
एक राशि A, B, C और D के बीच विभाजित की जाती है, जैसे A और B के शेयरों का अनुपात 1: 3 है, B और C का अनुपात 2: 5 है और C और D का अनुपात 2 :3 है. यदि A और C के शेयरों के बीच अंतर ₹3,510 है, तो D का हिस्सा है
View SolutionIn the given triangle, D and E is the middle point of AF and AG, respectively, F and G are the midpoint of AB and AC respectively. If DE is 2.4 cm then what is the value of BC? नीचे दिए गए त्रिभुज में , D और E क्रमश : AF और AG के मध्य बिंदु है , F और G क्रमश : AB और AC के मध्य बिंदु है | यदि DE =2.4 cm है तो BC का मान कया है?
View SolutionThe given table represents the number of engineers recruited by four companies A,B,C and D over the years. Study the table carefully and answer the questions that follows: The ratio of the total number of engineers recruited by companies A and B in 2015 and 2018 to the total number of engineers recruited by C and D in 2014 and 2018 is: दी गयी तालिका चार कंपनियों A, B, C और D के द्वारा इन वर्षों के दौरान भर्ती किये गए इंजीनियरों की संख्या दर्शाती है | इस तालिका का ध्यानपूर्वक अध्ययन करें तथा इसके बाद पूछे गए प्रश्न का उत्तर दें | कंपनी A और B के द्वारा 2015 और 2018 में भर्ती किये गए इंजीनियरों की कुल संख्या एवं C तथा D के द्वारा 2014 और 2018 में भर्ती किये गए इंजीनियरों की कुल संख्या के बीच अनुपात ज्ञात करें |
View SolutionThe given table represents the number of engineers recruited by four companies A,B,C and D over the years. Study the table carefully and answer the questions that follows: The total number of engineers recruited by the company B in 2014 and 2017 is what percentage of the total number of engineers recruited by C during 2015 to 2019? दी गयी तालिका चार कंपनियों A, B, C और D के द्वारा इन वर्षों के दौरान भर्ती किये गए इंजीनियरों की संख्या दर्शाती है | इस तालिका का ध्यानपूर्वक अध्ययन करें तथा इसके बाद पूछे गए प्रश्न का उत्तर दें | कंपनी B के द्वारा 2014 और 2017 में भर्ती किये गए इंजीनियरों की कुल संख्या C के द्वारा 2015 से 2019 के दौरान भर्ती किये गए इंजीनियरों की कुल संख्या का कितना प्रतिशत है ?
View SolutionStudy the pie chart and answer the question that follows
आरेख का अध्ययन करें और प्रश्न का उत्तर दे।
Break up (degree wise) of students in terms of specialization in different areas (A,B,C,D&E) in MBA program.
MBA कार्यक्रम में विभिन्न क्षेत्रों (A, B, C, D और E) में विशेषज्ञता के संदर्भ में छात्रों का वितरण
The number of students specialising in E is what percent more than that of students specialising in C?
E में विशेषज्ञता प्राप्त छात्रों की संख्या, C में विशेषज्ञता प्राप्त छात्रों की संख्या की तुलना में कितना प्रतिशत अधिक है?
View Solution
