Study the pie chart and answer the question that follows
आरेख का अध्ययन करें और प्रश्न का उत्तर दे।
Break up (degree wise) of students in terms of specialization in different areas (A,B,C,D&E) in MBA program.
MBA कार्यक्रम में विभिन्न क्षेत्रों (A, B, C, D और E) में विशेषज्ञता के संदर्भ में छात्रों का वितरण

The number of students specialising in E is what percent more than that of students specialising in C?
E में विशेषज्ञता प्राप्त छात्रों की संख्या, C में विशेषज्ञता प्राप्त छात्रों की संख्या की तुलना में कितना प्रतिशत अधिक है?
25.9
32
35
30.4
Step by step video & image solution for Study the pie chart and answer the question that follows आरेख का अध्ययन करें और प्रश्न का उत्तर दे। Break up (degree wise) of students in terms of specialization in different areas (A,B,C,D&E) in MBA program. MBA कार्यक्रम में विभिन्न क्षेत्रों (A, B, C, D और E) में विशेषज्ञता के संदर्भ में छात्रों का वितरण The number of students specialising in E is what percent more than that of students specialising in C? E में विशेषज्ञता प्राप्त छात्रों की संख्या, C में विशेषज्ञता प्राप्त छात्रों की संख्या की तुलना में कितना प्रतिशत अधिक है? by Maths experts to help you in doubts & scoring excellent marks in Class 14 exams.
Updated on:21/07/2023Topper's Solved these Questions
Similar Questions
Study the pie-chart and answer the questions:
Break up (degree wise) of students in terms of specialization in different areas(A, B, C, D & E) in an MBA program.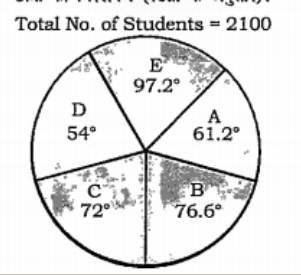
The number of students specialising in E is what percent more than that of students specialising in C?
पाई-चार्ट का अध्ययन करें और प्रश्नों के उत्तर दें: एमबीए प्रोग्राम में विभिन्न क्षेत्रों (ए, बी, सी, डी एंड ई) में विशेषज्ञता के मामले में छात्रों का ब्रेक अप (डिग्री वार)।

E में विशेषज्ञता प्राप्त छात्रों की संख्या C में विशेषज्ञता वाले छात्रों से कितने प्रतिशत अधिक है?
View SolutionStudy the pie-chart and answer the questions:
Break up (degree wise) of students in terms of specialization in different areas(A, B, C, D & E) in an MBA program.
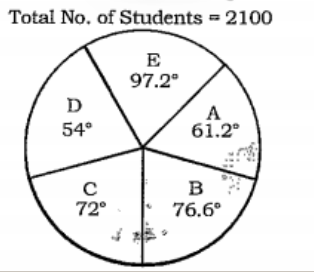
The total number of students specialising in A and B exceeds the total number of students specialising in C and D by x, which lies between:
पाई-चार्ट का अध्ययन करें और प्रश्नों के उत्तर दें: एमबीए प्रोग्राम में विभिन्न क्षेत्रों (ए, बी, सी, डी एंड ई) में विशेषज्ञता के मामले में छात्रों का ब्रेक अप (डिग्री वार)। <

ए और बी में विशेषज्ञता वाले छात्रों की कुल संख्या सी और डी में विशेषज्ञता वाले छात्रों की कुल संख्या से अधिक है।
View SolutionStudy the given graph and answer the question that follows.
दिए गए आरेख का अध्ययन करें और उन सवालों के जवाब दें जो अनुसरण करते हैं।
Break up for distribution ( degree wise) of the employees working in five departments (A, B, C, D and E) in a company
एक कंपनी के पाँच विभागों (A, B, C, D and E) में कार्य करने वाले कर्मचारियों का वितरण (डिग्री अनुसार):
The number of employees in department B is what percent of the total number of employees working in department D and E ?
विभाग B में कर्मचारियों की संख्या विभाग D और E में कार्यरत कर्मचारियों की कुल संख्या का कितना प्रतिशत है?
View SolutionStudy the bar diagram and answer the questions.
बार-आरेख का अध्ययन करें और प्रश्नों का उत्तर दें।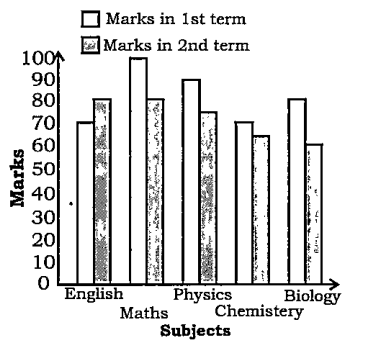 Average marks obtianed by the students for all subjects in second term is
दूसरी बार में सभी विषयों में छात्रों द्वारा प्राप्त औसत अंक क्या हे?
View SolutionIn the given bar graph, the percentage decrease in the number of students in Institute A in 2016 is what percent of students in 2015.
इस दंड आरेख में संस्थान A में 2016 में छात्रों की संख्या में प्रतिशत कमी 2015 के छात्रों की संख्या का क्या प्रतिशत है ?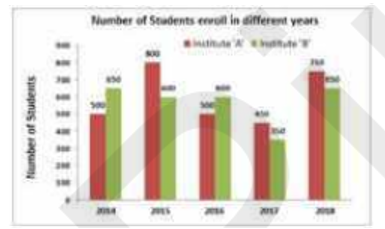
View SolutionStudy the given pie chart and answer the question that follows
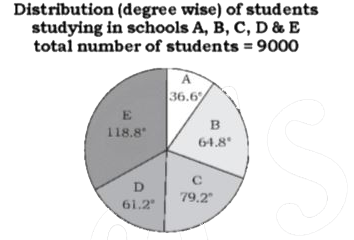
The total number of students in schools D and E is what percentage more than the number of students in schools B and C?
View SolutionThis table shows the number of students studying in various streams in different colleges.
निम्नलिखित तालिका पांच कॉलेजों के तीन विषयों में पढ़ने वाले छात्रों की संख्या दर्शाती है | The number of students in the science stream of college C is approximately what percentage of
students studying in that college?
कॉलेज C में विज्ञान विषय में छात्रों की संख्या उस कॉलेज में पढ़ने वाले छात्रों की संख्या का लगभग कितना प्रतिशत है ?
View SolutionStudy the bar diagram and answer the questions.
बार-आरेख का अध्ययन करें और प्रश्नों का उत्तर दें।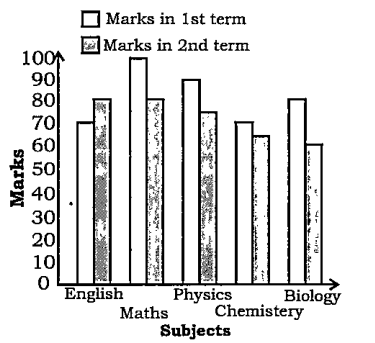 Ratio of highest and lowest
marks obtained in first term among all the subjects is
सभी विषयों में, पहली बार में प्राप्त उच्चतम और निम्नतम अंकों का अनुपात है-
View SolutionStudy the graph and answer the questions based on the graph:
आरेख का अध्ययन करें और आरेख के आधार पर प्रश्नों के उत्तर दें: What was the percentage decline in the production from Friday to Saturday?
शुक्रवार से शनिवार तक उत्पादन में कितने प्रतिशत की गिरावट रही?
View SolutionStudy the graph and answer the question that follows
आरेख का अध्ययन करें और प्रश्न का उत्तर दे।
In which year was the production of computers by the company 16% more than the average exports of computers in the six years (2013 to 2018)?
किस वर्ष कंपनी के द्वारा कंप्यूटरों का उत्पादन छः वर्षों (2013 से 2018) में कंप्यूटरों के औसत निर्यात से 16% अधिक था?
View Solution
