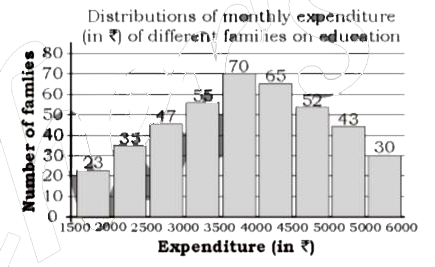
ग्राफ का अध्ययन करे और उसके बाद दिए गए प्रश्न का उत्तर दे।

शिक्षा पर Rs 2,500 या अधिक लेकिन Rs 4,000 से कम मासिक व्यय करने वाले परिवारों की संख्या, शिक्षा पर Rs 4,500 या अधिक लेकिन Rs 6,000 से कम मासिक व्यय करने वाले परिवारों की संख्या से कितने प्रतिशत अधिक है ?
37.6
27.3
29.8
36.4
The correct Answer is:A
Step by step video, text & image solution for ग्राफ का अध्ययन करे और उसके बाद दिए गए प्रश्न का उत्तर दे। शिक्षा पर Rs 2,500 या अधिक लेकिन Rs 4,000 से कम मासिक व्यय करने वाले परिवारों की संख्या, शिक्षा पर Rs 4,500 या अधिक लेकिन Rs 6,000 से कम मासिक व्यय करने वाले परिवारों की संख्या से कितने प्रतिशत अधिक है ? by Maths experts to help you in doubts & scoring excellent marks in Class 14 exams.
Topper's Solved these Questions
Similar Questions
यदि A:B=2:3 और B:C=3:7, तो A+B:B+C:C+A क्या होगा?
01:13View SolutionP और Q की वर्तमान आयु के बीच का क्रमशः अनुपात 3 : 4 है। चार वर्ष बाद Q, P से पाँच वर्ष बड़ा होगा।P की वर्तमान आयु कितनी है?
44:30View Solutionकिसी संख्या का वर्ग उसके तिगुने से 70 अधिक है। इस कथन को प्रकट करने वाला समीकरण है -
51:21View Solution100 से अधिक परमाणु क्रमांक वाले तत्त्वों का नामकरण
05:07View Solutionदो या दो से अधिक लेंसों का समायोजन
01:53View Solutionएक पासे को फेंका जाता है। निम्नलिखित प्रत्येक घटना की प्रायिकता ज्ञात कीजिए।
(a) 2 से बड़ी एक संख्या प्राप्त करना
(b) अधिक-से-अधिक 4 प्राप्त करना
(c ) कम-से-कम 5 प्राप्त करना05:12View Solutionवर्गीकृत आंकड़ों की 'से कम प्रकार' और 'से अधिक प्रकर' की संचयी बारम्बारता वक्रों के प्रतिच्छेद बिन्दु के 'भुज' से प्राप्त होता है आंकड़ों का----
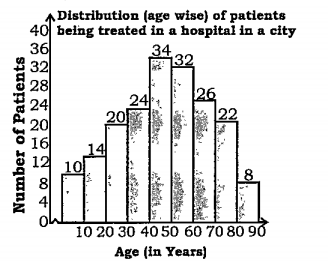
04:26View SolutionStudy the given graph and answer the question that follows. The number of patients aged 10 or more years but below 40 years is what per cent less than the number of patients aged 50 or more years but below 80 years?

दिए गए ग्राफ का अध्ययन करें और नीचे दिए गए प्रश्न का उत्तर दें । 10 या उससे अधिक वर्ष लेकिन 40 वर्ष से कम आयु वालें मरीजों की संख्या, 50 वर्ष या उससे अधिक लेकिन 80 वर्ष से कम आयु वाले मरीजों को संख्या से कितने प्रतिशत कम हैं?01:14View Solution
Study the given graph and answer the question that follows: The number of weeks, iin which the cost of living index was 160 or more but less than 190, is approximately what percent more than the number of weeks in which the cost of livinig index was 200 or more but less than 220 (correct to one decimal place)? दिए गए ग्राफ का अध्ययन करें और उस प्रश्न का उत्तर दें जो निम्न है: सप्ताह की संख्या, iin जो लिविंग इंडेक्स की लागत 160 या उससे अधिक है, लेकिन 190 से कम है, लगभग यही है। उन सप्ताहों की तुलना में प्रतिशत अधिक है जिनमें लिविन्ग इंडेक्स की लागत 200 या उससे अधिक थी लेकिन 220 से कम (एक दशमलव स्थान के लिए सही)?
02:52View SolutionTwo numbers A and B are, respectively, 80% and 20% more than a third number C. The ratio of the numbers A to B is:
दो संख्या A और B क्रमशः, 80% और 20% अधिक है एक तीसरी संख्या C से । A से B की संख्या का अनुपात है02:46View SolutionThe income of Renu is 10% less than the income of Sudha, and the income of Sudha is 10% more than Rs.3000. The income of Renu is:
रेणु की आय सुधा की आय से 10% कम है और सुधा की आय 3000 रुपये से 10% अधिक है। रेणु की आय है:02:07View SolutionA trader gives a discount of 4% for purchases above Rs.25,000, 6% for purchases above Rs.35000 and 8% for purchases above Rs. 50,000. If the price of an item is marked Rs.38,500. What would be the amount of discount?
एक व्यापारी 25,000 रुपये से अधिक की खरीद पर 4%, 35000 रुपये से अधिक की खरीद पर 6% तथा 50,000 रुपये से अधिक की खरीद पर 8% की छूट देता है | यदि किसी वस्तु का मूल्य 38,500 रुपये अंकित किया गया है, तो छूट की राशि क्या होगी ?01:49View SolutionThe given graph shows the marks obtained by students in an examination.
दिया गया आरेख किसी परीक्षा में छात्रों के प्राप्तांक दर्शाता है | The number of students who obtained less than 300 marks is what percent more than the number of students who obtained 350 or more marks?
300 अंक से कम प्राप्त करने वाले छात्रों की संख्या 350 या इससे अधिक अंक प्राप्त करने वाले छात्रों की संख्या से कितना प्रतिशत अधिक है ?03:09View SolutionHow many families have a monthly salary less than ₹40,000?
कितने परिवारों का मासिक वेतन 40,000 रुपये से कम है ?03:38View SolutionStudy the following histogram and answer the given question
निम्नलिखित आयत चित्र का अध्ययन करें और दिए गए प्रश्न का उत्तर दें।
What is the ratio of the number of students who scored 30 or more marks, but below 40 marks, to the total number of students in the entrance examination ?
प्रवेश परीक्षा में 30 या अधिक लेकिन 40 से कम अंक लाने वाले छात्रों की संख्या का प्रवेश परीक्षा में शामिल कुछ छात्रों की संख्या से क्या अनुपात है?02:29View SolutionStudy the given histogram that shows the marks obtained by students in an examination and answer the questions that follow
दिए गए हिस्टोग्राम का अध्ययन करें जो एक परीक्षा में छात्रों द्वारा प्राप्त किए गए अंकों को दिखाता है और आने वाले प्रश्नों का उत्तर ज्ञात करे|
The number of students who obtained less than 350 marks is what percent more than the number of students who obtained 400 or more marks?(correct to one decimal place )
350 से कम अंक प्राप्त करने वाले छात्रों की संख्या 400 या अधिक अंक प्राप्त करने वाले छात्रों की संख्या की तुलना में प्रतिशत अधिक है| (एक दशमलव स्थान तक )04:23View Solution

