दिया गया पाई-चार्ट एक देश द्वारा एक विशेष वर्ष के दौरान विभिन्न खेलो पर किये गए व्यय को प्रदर्शित करता है । पाई-चार्ट का अध्ययन करे और नीचे दिए गए प्रश्न का उत्तर दे।
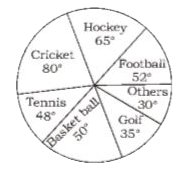
हॉकी पर किया गया व्यय, बास्केटबॉल पर किये गए व्यय से कितने प्रतिशत अधिक है ?
30%
40%
25%
35%
The correct Answer is:A
Step by step video, text & image solution for दिया गया पाई-चार्ट एक देश द्वारा एक विशेष वर्ष के दौरान विभिन्न खेलो पर किये गए व्यय को प्रदर्शित करता है । पाई-चार्ट का अध्ययन करे और नीचे दिए गए प्रश्न का उत्तर दे। हॉकी पर किया गया व्यय, बास्केटबॉल पर किये गए व्यय से कितने प्रतिशत अधिक है ? by Maths experts to help you in doubts & scoring excellent marks in Class 14 exams.
Topper's Solved these Questions
Similar Questions
यदि A:B=2:3 और B:C=3:7, तो A+B:B+C:C+A क्या होगा?
01:06View SolutionP और Q की वर्तमान आयु के बीच का क्रमशः अनुपात 3 : 4 है। चार वर्ष बाद Q, P से पाँच वर्ष बड़ा होगा।P की वर्तमान आयु कितनी है?
01:15View SolutionThe pie chart given below shows the expenditure on various items and savings of a family during the year 2009. Study the pie chart and answer these questions. नीचे दिया गया याई-चार्ट वर्ष २००९ में एक परिवार द्वारा विभिन्न मदों पर व्यय की गई धनराशि तथा बचत को प्रदर्शित करता है। पाईं-चार्ट का अध्ययन कीजिये तथा इस पर आधारित प्रश्नों का उत्तर दीजिये- Maximum expenditure of the family other than on food, was on परिवार द्वारा किसी मद पर भोजन के सिवाय सर्वाधिक व्यय किया गया?
01:48View SolutionThe given pie-chart, shows the percentage distribution of the expenditure incurred in publishing a book. Study the pie-chart and the answer the question based on it. / दिया गया पाई चार्ट किसी पुस्तक के प्रकाशन में हुए व्ययों के प्रतिशत वितरण को दर्शाता है | इस पाई चार्ट का अध्ययन करें तथा इस पर आधारित प्रश्न का उत्तर दें | In the given pie-chart, by what percentage the Royalty on the book is less than the Printing cost? / दिए गए पाई चार्ट के अनुसार, इस पुस्तक पर रॉयल्टी प्रकाशन की लागत से कितना प्रतिशत कम है ?
03:15View SolutionThe given pie chart shows the expenditure given in millions on each game. दिया गया पाई चार्ट प्रत्येक खेल पर करोड़ो में दिए गए व्यय को दर्शाता है | In the given pie chart, what is the difference between expenditure on cricket and football ? दिए गए पाई चार्ट में , क्रिकेट और फुटबॉल पर किये गए व्यय के बीच क्या अंतर है ?
02:01View SolutionThe Table given below presents the annual expenses (in thousands) on various heads made by a firm during 2006-2010. By how much percentage (correct up to two decimal places) is the average expenditure on purchases more than the average expenditure on rent? नीचे दी गयी तालिका एक फर्म के द्वारा 2006-2010 के दौरान विभिन्न मदों पर किये गए वार्षिक व्ययों ( हज़ार में ) को दर्शाती है | क्रय पर किया गया औसत व्यय किराये पर किये गए औसत व्यय से कितना प्रतिशत ( दो दशमलव स्थान तक ) अधिक है ?
01:37View SolutionThe Pie-chart given below shows the figures of various heads of expenditure incurred by Anurag in a year. In how many heads is his expenditure less than the expenditure he incurred on tax?
नीचे दिया गया वृत्त आरेख अनुराग द्वारा किसी वर्ष में किए गए व्यय के विभिन्न शीर्षों के आंकड़ों को दर्शाता है | उसके द्वारा टैक्स पर किए गए व्यय की तुलना में कितने शीर्षों में उसके व्यय कम हैं ?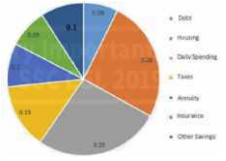 01:28View Solution
The given graph represents the percentage distribution of the total expenditure of a company. Study the graph and answer the question that follows.
दिया गया आरेख एक कंपनी के कुल व्यय के प्रतिशत वितरण को दर्शाता है। आरेख का अध्ययन कीजिए और फिर पूछे गए प्रश्न का उत्तर दीजिए।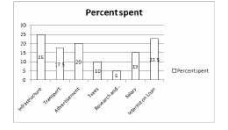 What is the ratio of the total expenditure on .Infrastructure. and .Transport. to the total expenditure on .Taxes. and .Interest on Loans.?
‘आधारभूत संरचना’(Infrastructure) तथा “परिवहन. (Transport) पर किये गए कुल व्यय और “करों (Taxes) तथा “ऋण पर ब्याज.(Interest on loans) पर किये गए कुल व्यय के बीच अनुपात ज्ञात कीजिए।01:26View SolutionThe given graph represents the percentage distribution of the total expenditure of a company. Study the graph and answer the question that follows.
दिया गया आरेख एक कंपनी के कुल व्यय के प्रतिशत वितरण को दर्शाता है। आरेख का अध्ययन कीजिए और फिर पूछे गए प्रश्न का उत्तर दीजिए।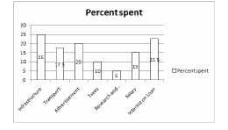 The total expenditure of the company is how many times the total expenditure on .Research
and Development. and .Salary.?
कंपनी का कुल व्यय .शोध तथा विकास (Reaserch and Development)’ और .वेतन.(Salary) पर किये गए कुल व्यय से कितना गुना है ?02:19View SolutionThe given graph represents the percentage distribution of the total expenditure of a company. Study the graph and answer the question that follows.
दिया गया आरेख एक कंपनी के कुल व्यय के प्रतिशत वितरण को दर्शाता है। आरेख का अध्ययन कीजिए और फिर पूछे गए प्रश्न का उत्तर दीजिए। The expenditure on .Interest on loans. is what percentage more than the expenditure on
.Transport.?
.ऋण पर ब्याज. (Interest on loans) में किया गया व्यय “परिवहन (Transport) पर किये गए व्यय से कितना प्रतिशत अधिक है ?01:35View SolutionStudy the following pie-chart and answer the given questions. The pie chart shows the Budget Expenditure of a company in the year 2018 (percentage distribution) on different heads A, B, C, D and E. If ₹165 crore were spent in the year 2018 on A, what would have been the total expenditure for that year (in ₹ crores)?
निम्नलिखित पाई-चार्ट का अध्ययन करें और दिए गए प्रश्नों के उत्तर दें
पाई चार्ट वर्ष 2018 में एक कंपनी के बजट व्यय को अलग-अलग प्रमुखों A, B, C, D और E पर दिखाया गया है।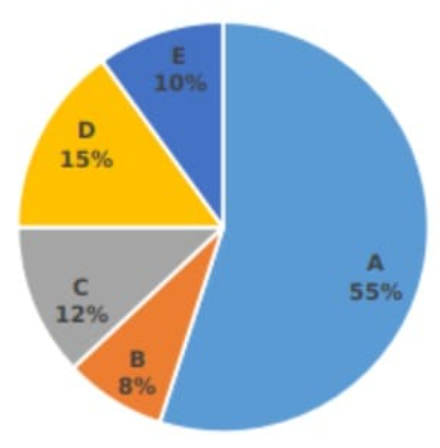
यदि A पर वर्ष 2018 में ₹165 करोड़ खर्च किए गए थे, तो उस वर्ष (₹ करोड़ों में) कुल खर्च क्या रहा होगा?02:54View SolutionThe following pie chart shows the monthly expenditure incurred by a family on various items, and their savings. Study the chart and answer the question that follows
निम्नलिखित पाई चार्ट विभिन्न मदों पर एक परिवार द्वारा किए गए मासिक खर्च और उनकी बचत को दर्शाता है। चार्ट का अध्ययन करें और फिर पूछे गए प्रश्न का उत्तर दें।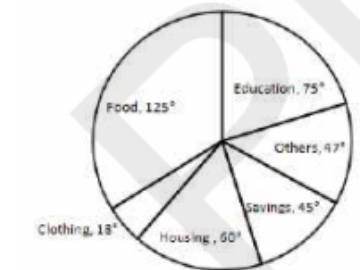 If the monthly income is ₹64,800, then the yearly savings are:
यदि मासिक आय ₹64,800 है, तो वार्षिक बचत होती है:01:57View SolutionThe following pie chart shows the monthly expenditure incurred by a family on various items, and their savings. Study the chart and answer the question that follows
निम्नलिखित पाई चार्ट विभिन्न मदों पर एक परिवार द्वारा किए गए मासिक खर्च और उनकी बचत को दर्शाता है। चार्ट का अध्ययन करें और फिर पूछे गए प्रश्न का उत्तर दें।
If the expenditure on education is 2,700 more than that on housing, then the total expenditure on food and clothings is:
यदि शिक्षा पर खर्च आवास से ₹2,700 अधिक है, तो भोजन और कपड़े पर कुल खर्च ज्ञात करे।01:21View SolutionThe given pie chart shows the percentage distribution of 450 employees in an organization. Study the pie chart and answer the questions that follow
दिए गए पाई चार्ट एक संगठन में 450 कर्मचारियों के प्रतिशत को दर्शाता है। पाई चार्ट का अध्ययन करें और आने वाले प्रश्नों का उत्तर दें।
What is the central angle of the sector representing the number of employees in department A?
विभाग A में कर्मचारियों की संख्या का प्रतिनिधित्व करने वाले क्षेत्र का केंद्रीय कोण क्या है?02:44View SolutionThe following pie chart shows percentage expenditure of a country on different heads. The total expenditure is Rs.1,680 (in billions). Study the chart and answer the questions
निम्नलिखित पाई चार्ट अलग-अलग प्रमुखों पर किसी देश का प्रतिशत व्यय दर्शाता है। कुल खर्च रु1,680 (अरबों में)। चार्ट का अध्ययन करें और प्रश्नों का उत्तर दें |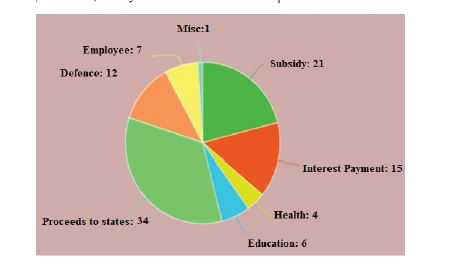 The central angle of the sector representing expenditure on subsidy is :
सब्सिडी पर व्यय का प्रतिनिधित्व करने वाले क्षेत्र का केंद्रीय कोण ज्ञात करे |03:17View SolutionThe following pie chart shows percentage expenditure of a country on different heads. The total expenditure in Rs. 1,680(in billion). Study the chart and answer the question.
निम्नलिखित पाई चार्ट अलग-अलग प्रमुखों पर किसी देश का प्रतिशत व्यय दर्शाता है। 1,680 (बिलियन में) कुल खर्च। चार्ट का अध्ययन करें और प्रश्न का उत्तर दें।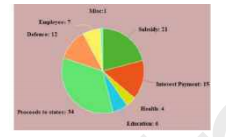 The expenditure for proceeds to state (in billion ₹) is:02:06View Solution

