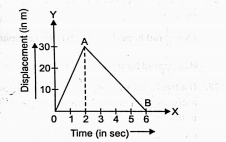
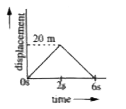
The displacement-time graph of a motion is shown in figure.The ratio of the speeds during the rfirst two seconds and the next four seconds is :
 .Solution in Punjabi
1:1
1:2
2:1
1:√2.
Step by step video & image solution for The displacement-time graph of a motion is shown in figure.The ratio of the speeds during the rfirst two seconds and the next four seconds is :. by Physics experts to help you in doubts & scoring excellent marks in Class 11 exams.
Updated on:21/07/2023Topper's Solved these Questions
Similar Questions
Is it possible that the velocity of an object be in a direction other than the direction of acceleration?
View SolutionA body is taken from the centre of the earth to the top of the mountain ,how does its weight change?
View SolutionGive one example each of
position depedent force
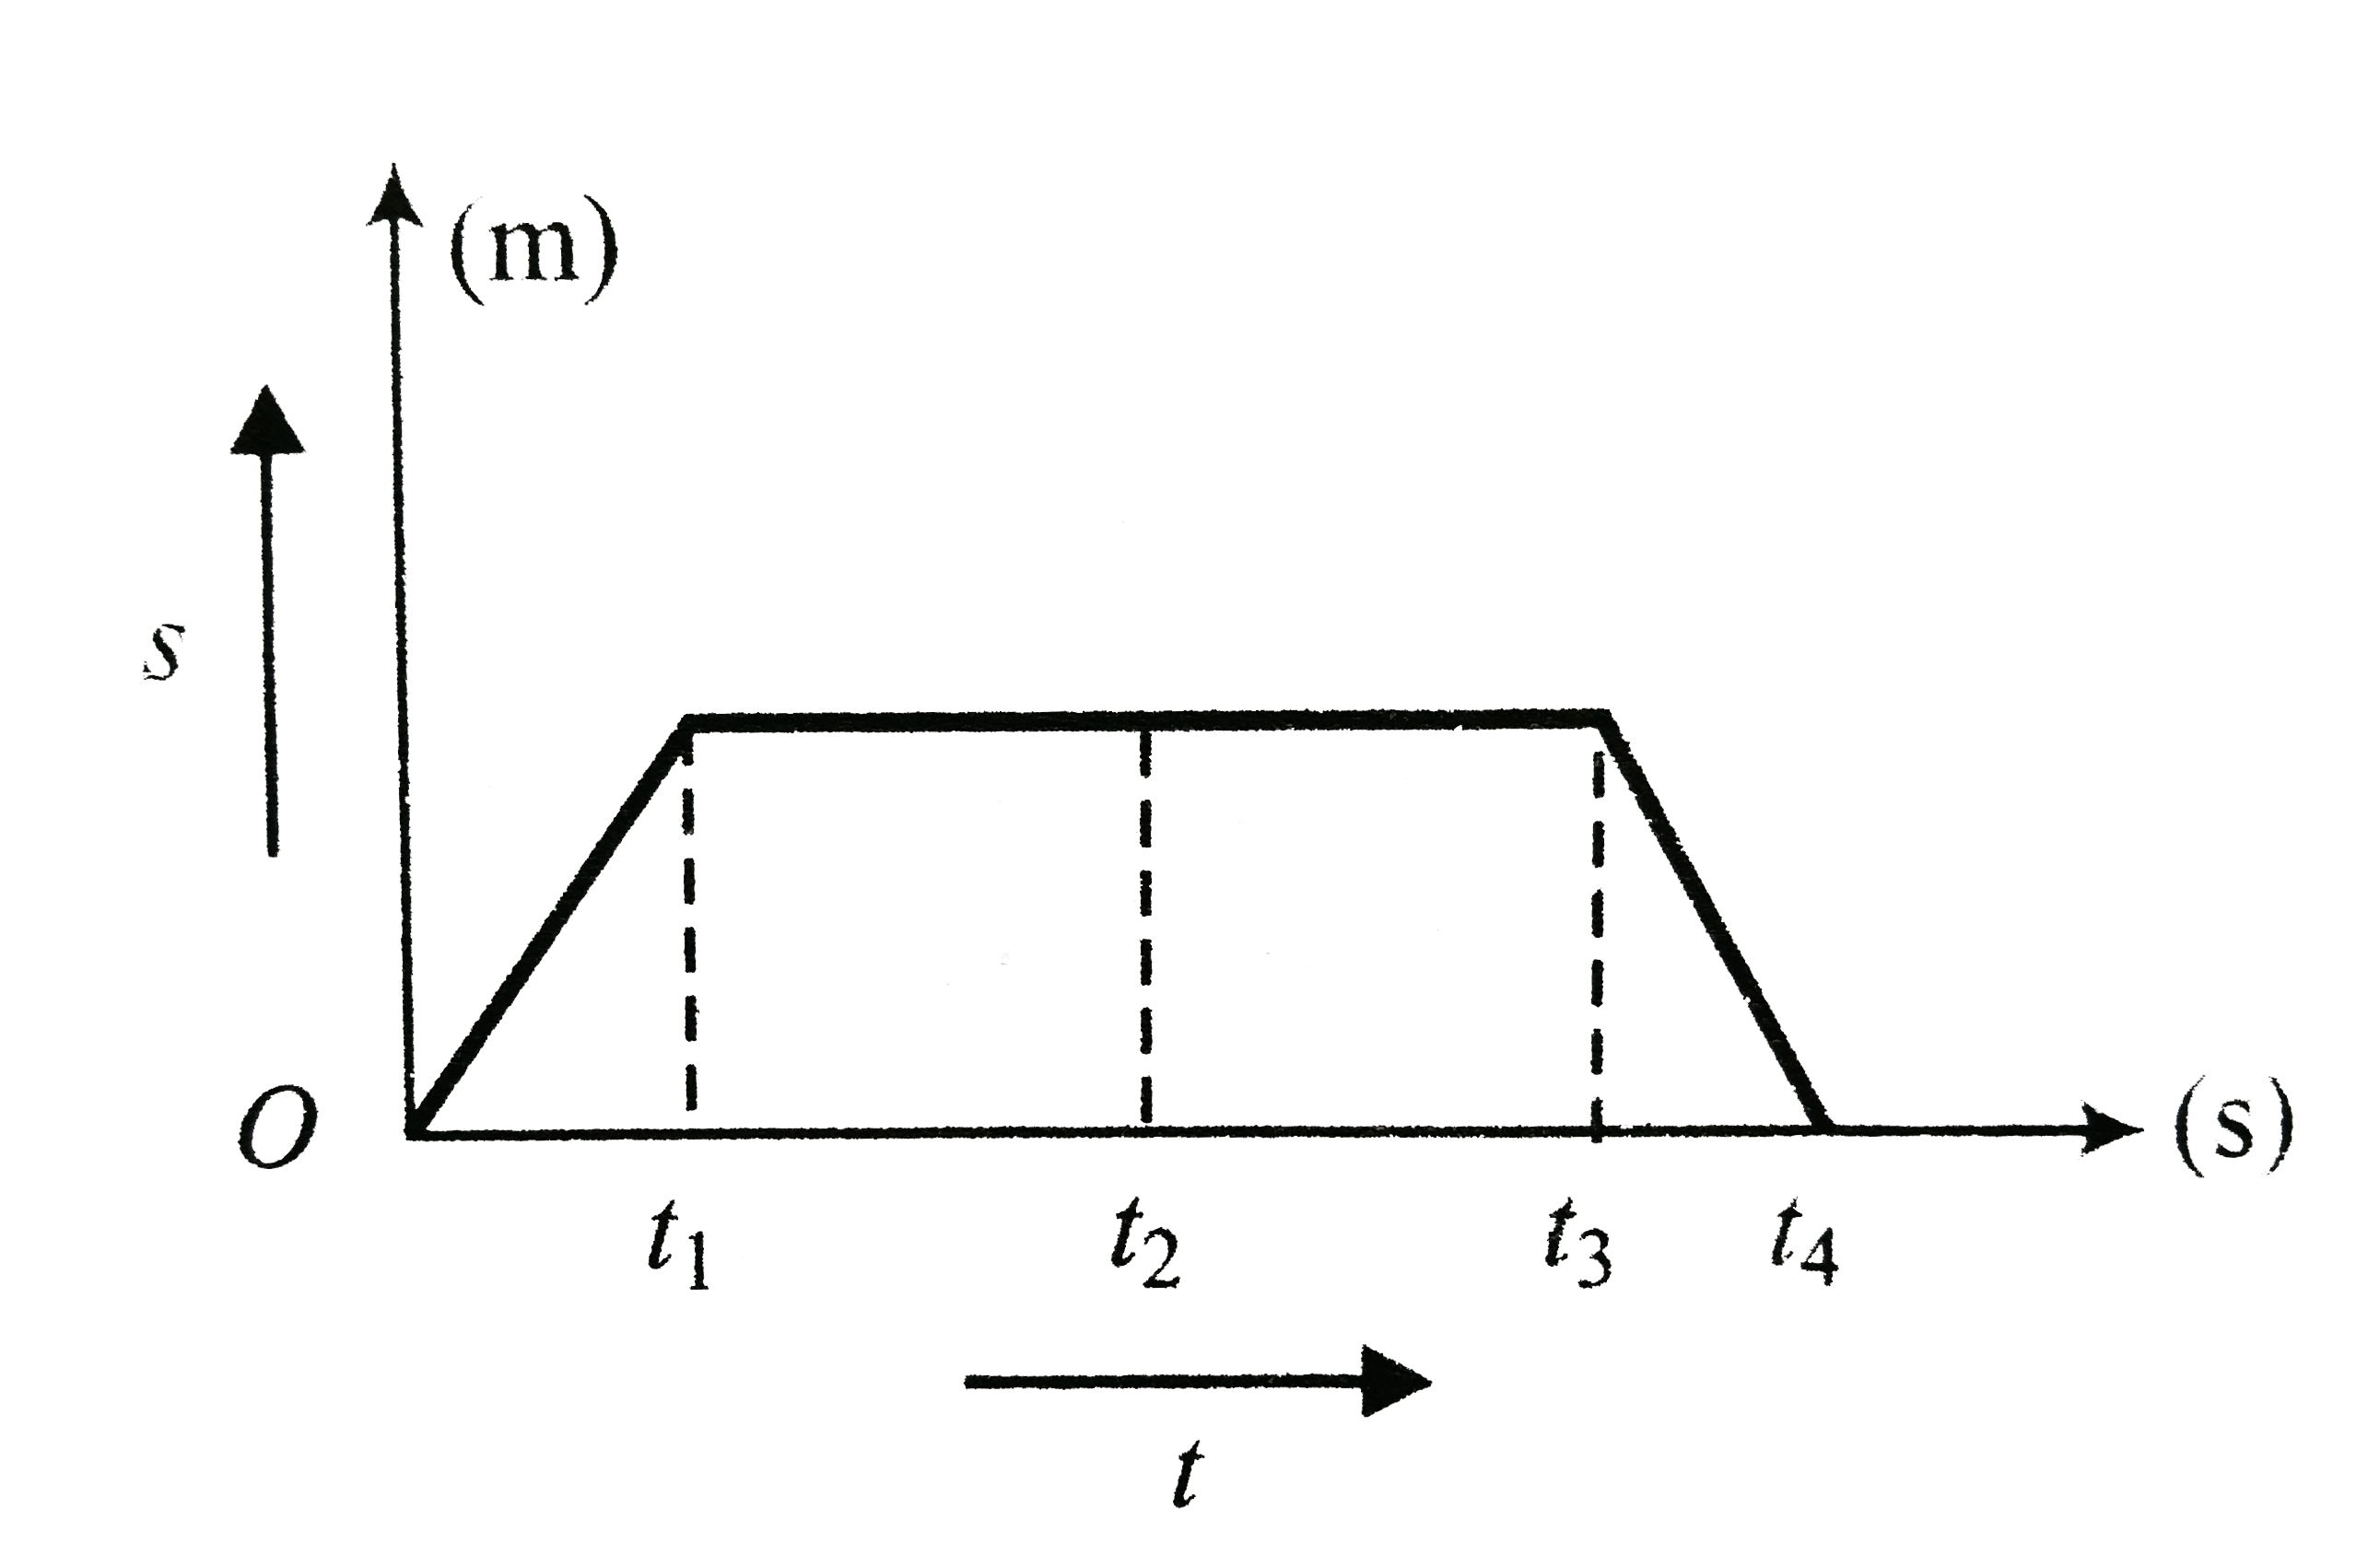
View SolutionThe displacement-time graph of a body is shown in.
 .
.
The velocity-time graph of the motion of the body will be .
View SolutionThe displacement-time graph for two particles is as shown. Find the ratio of their velocities.
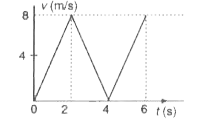
View SolutionThe velocity-time graph of a linear motion is shown below. Find the (a) displacement and distance from the origin after 8s . (b) acceleration in the first second. (c) deceleration during the 5^(th) second. (d) maximum speed during the motion.
View SolutionFor the displacement time graph shown in figure -1.100, the ratio of the speeds during the first two seconds and the next four second is :
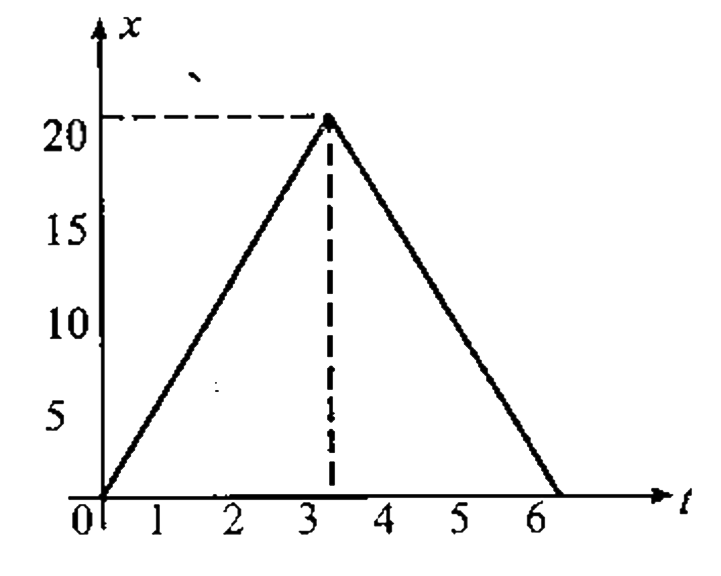
View SolutionThe velocity - time graph of an ascending passenger order lift is given in figure. What is the acceleration of the lift:
(i) during the first two seconds ,
(ii) between 2nd and 10th second,
(iii) during the last two seconds. .
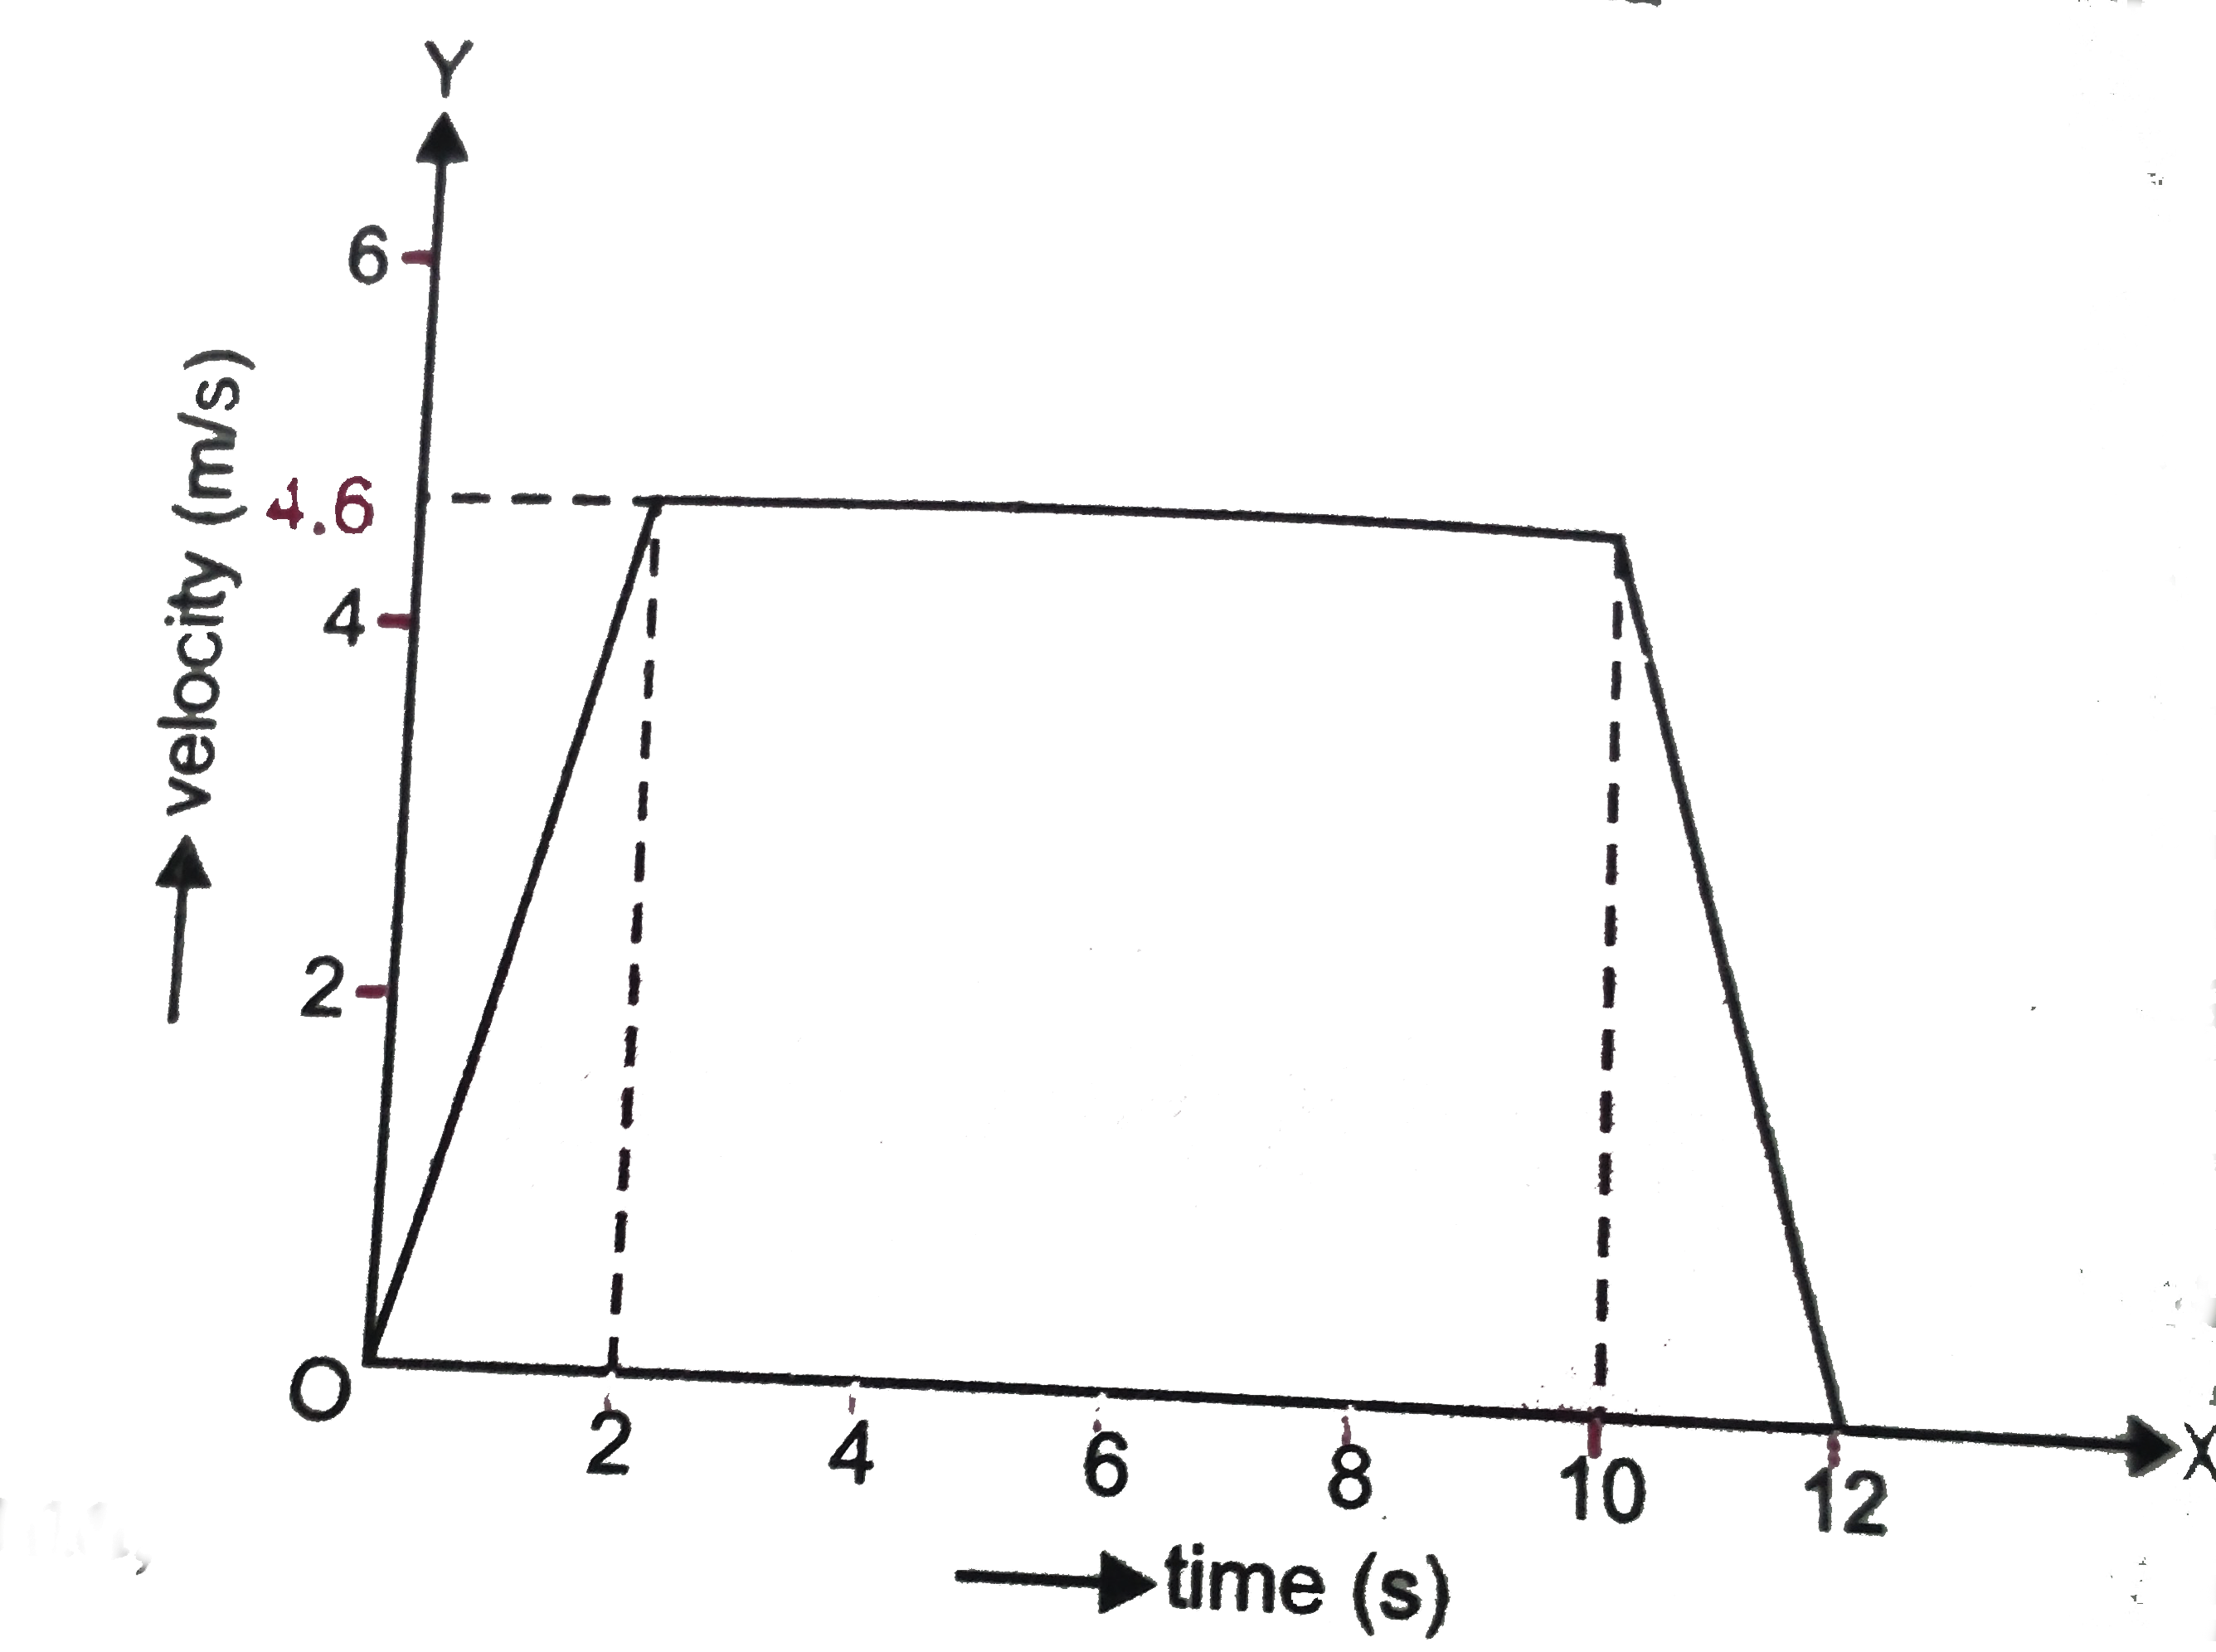
View SolutionWhat will be ratio of speed in first two seconds to the speed in next 4s
View SolutionFor the displacement-time graph shown in figure, the ratio of the magnitudes of the speeds during the first two second and the next four second is
View Solutionकिसी कण का वेग-समय ग्राफ दर्शाया गया है। प्रथम चार सेकण्ड में तय की गयी दूरी है
View SolutionFor the displacement-time graph shown in figure, the ratio of the magnitudes of the speeds during the first two second and the next four second is
View SolutionIn the graph shown the displacement of the body in 5 seconds will be
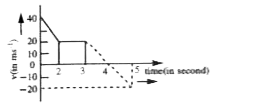
View SolutionThe velocity-time graph of an object is shown in the diagram, the displacement of the object in 5 seconds will be:
View SolutionVelocity -time graph for a body of mass 10 kg is shown in figure. Work -done on the body in first two seconds of the motion is :
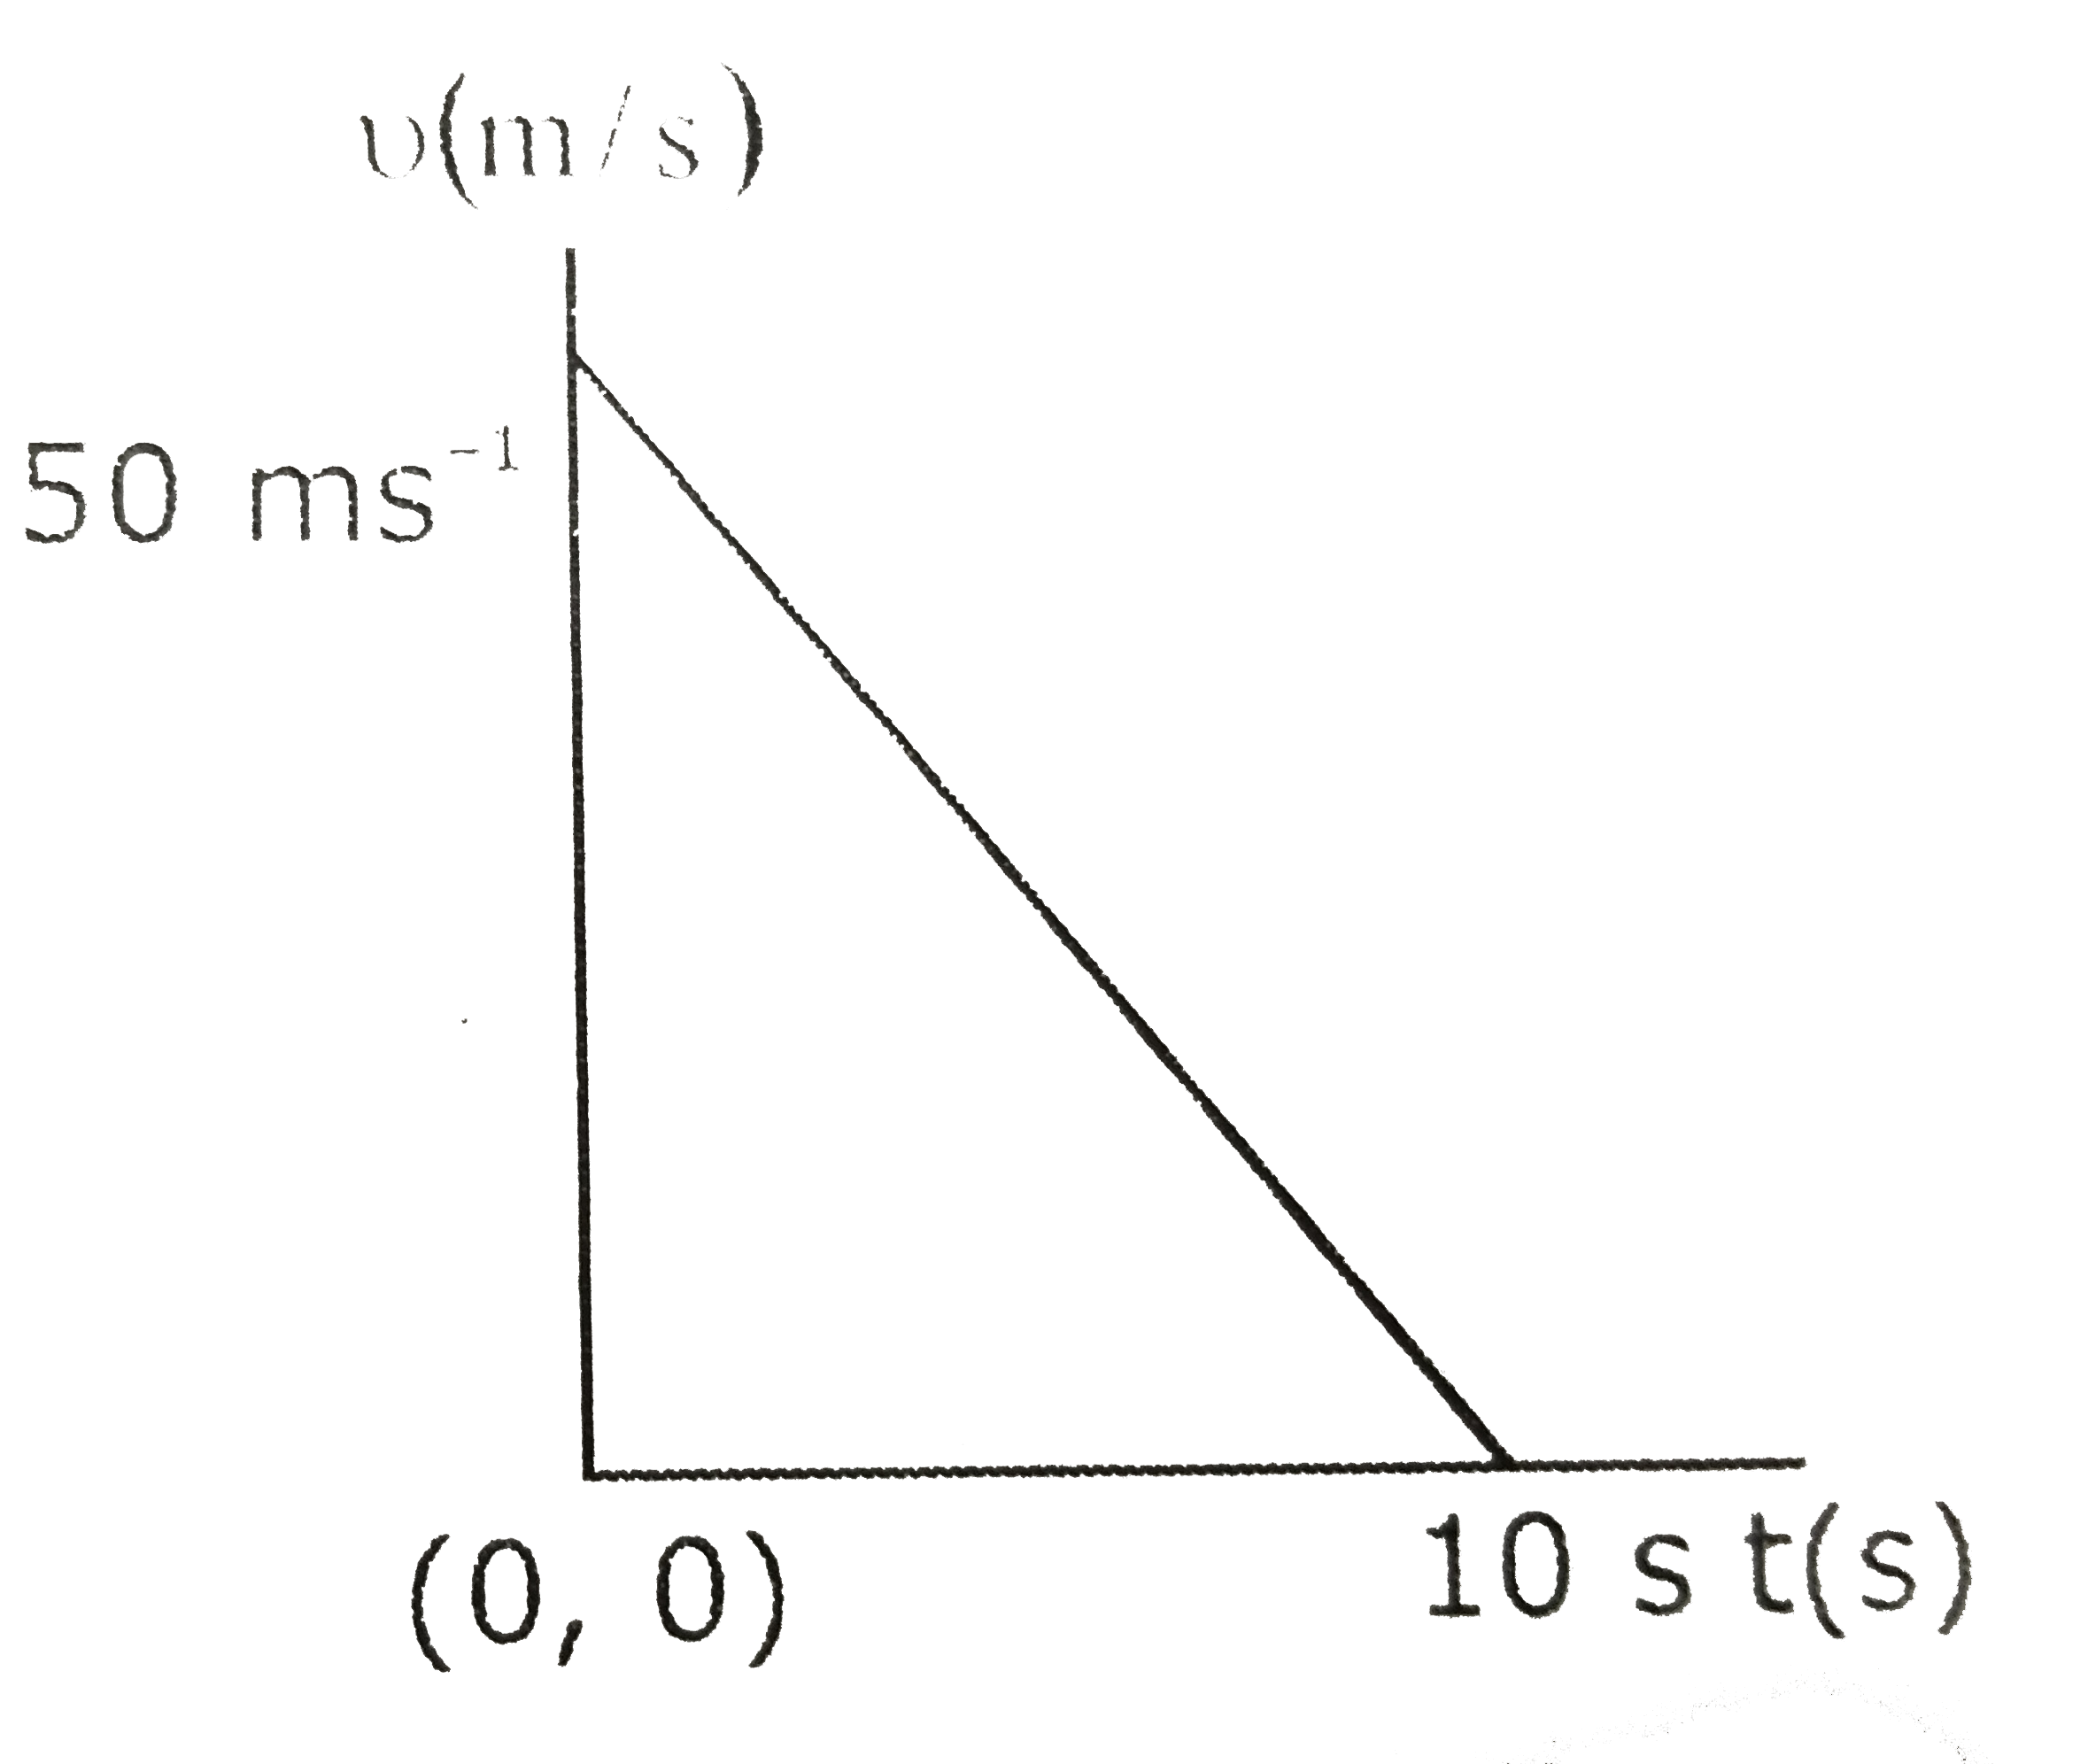
View SolutionWhat will be ratio of speed in first two seconds to the speed in next 4 seconds ?
View Solution
