Former cricketer Gautam Gambhir contested the Lok Sabha elections, 2019, from the _____ constituency on a Bharatiya Janata Party ticket.
West Delhi
New Delhi
South Delhi
East Delhi
The correct Answer is:D
Explanation: Former cricketer Gautam Gambhir contested the Lok Sabha elections, 2019, from the East Delhi constituency on a Bharatiya Janata Party ticket. In this election BJP won all the seven seats of Delhi.
Topper's Solved these Questions
- CURRENT AFFAIRSBOOK - PINNACLECHAPTER - CURRENT AFFAIRSEXERCISE - STATE
55 Videos
- CURRENT AFFAIRSBOOK - PINNACLECHAPTER - CURRENT AFFAIRSEXERCISE - SCHEMES & PROJECTS
40 Videos
- CURRENT AFFAIRSBOOK - PINNACLECHAPTER - CURRENT AFFAIRSEXERCISE - AWARDS
112 Videos
- CHEMISTRYBOOK - PINNACLECHAPTER - CHEMISTRYEXERCISE - MISCELLANEOUS
38 Videos
- ECONOMICSBOOK - PINNACLECHAPTER - ECONOMICSEXERCISE - MCQ (MISCELLANEOUS)
54 Videos
Similar Questions
Knowledge Check
Amit Shah contested the Lok Sabha elections 2019 from _____constituency.
AVaranasiBGandhinagarCAmethiDLucknowBJP had won how many seats in the Lok Sabha election 2019 ?
A320B350C303D280Former President Pranab Mukherjee won the first Lok Sabha Election in the year ______.
A1980B1991C2004D1998
The Lok Sabha elected after the 2019 elections is the ________ Lok Sabha.
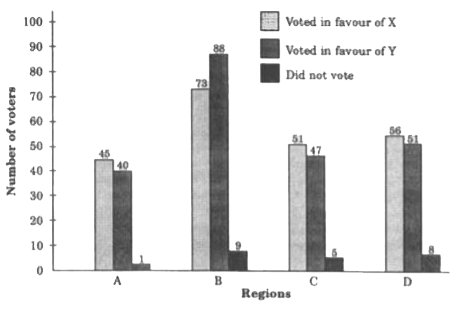
View SolutionA constituency is divided in four regions A,B,C and D . Two candidates X and Y contested the last election from that constituency . The adjoining graph gives the break - up of voting in the four regions . Study graph and answer the following questions .

Nearly what percentage of the total votes did X receive from region B ?
View SolutionA constituency is divided in four regions A,B,C and D . Two candidates X and Y contested the last election from that constituency . The adjoining graph gives the break - up of voting in the four regions . Study graph and answer the following questions .

Approximately how much percent of voted in favour of X ?
View SolutionA constituency is divided in four regions A,B,C and D . Two candidates X and Y contested the last election from that constituency . The adjoining graph gives the break - up of voting in the four regions . Study graph and answer the following questions .

Approximately how much percent of voters did not caste their votes?
View SolutionA constituency is divided in four regions A,B,C and D . Two candidates X and Y contested the last election from that constituency . The adjoining graph gives the break - up of voting in the four regions . Study graph and answer the following questions .
 In region B ,Y gets A% more votes than X , find the value of A.
View Solution
