Explain energy level diagram of hydrogen atom.
The transition of electron between different energy levels is shown by the vertical lines. The energy of each emitted photon is equal to the energy difference between corresponding energy levels.

The energy level diagram for hydrogen atom The energy of electron in the nth orbit of hydrogen atom is given by:
En=−13.6n2eV
where, n=1, E1=−13.6eV
This is the ground state energy of hydrogen atom.
When n=2
E2=−13.622=−13.64=−3.4eV
This is the first excited state of hydrogen atom.
When n = 3,
E3=−13.632=−13.69=1.51eV
This is the second excited state of hydrogen atom. When n = 4,
E4=−13.642=−13.616=−0.85eV
This is the third excited state of hydrogen atom.
When n=∞,E∞=−13.6∞2=0
So as n increases, the energy associated with the orbit becomes less negative. For n=∞, the energy becomes zero. The electron is no longer bound to the nucleus and becomes a free electron.
Similar Questions
Consider energy level diagram of a hydrogen atom.How will the kinetc energy and potential energy of electron moves from a lower level to a higher level?
View SolutionConsider energy level diagram of a hydrogen atom.How will the kinetc energy and potential energy of electron moves from a lower level to a higher level?
View Solution
Knowledge Check
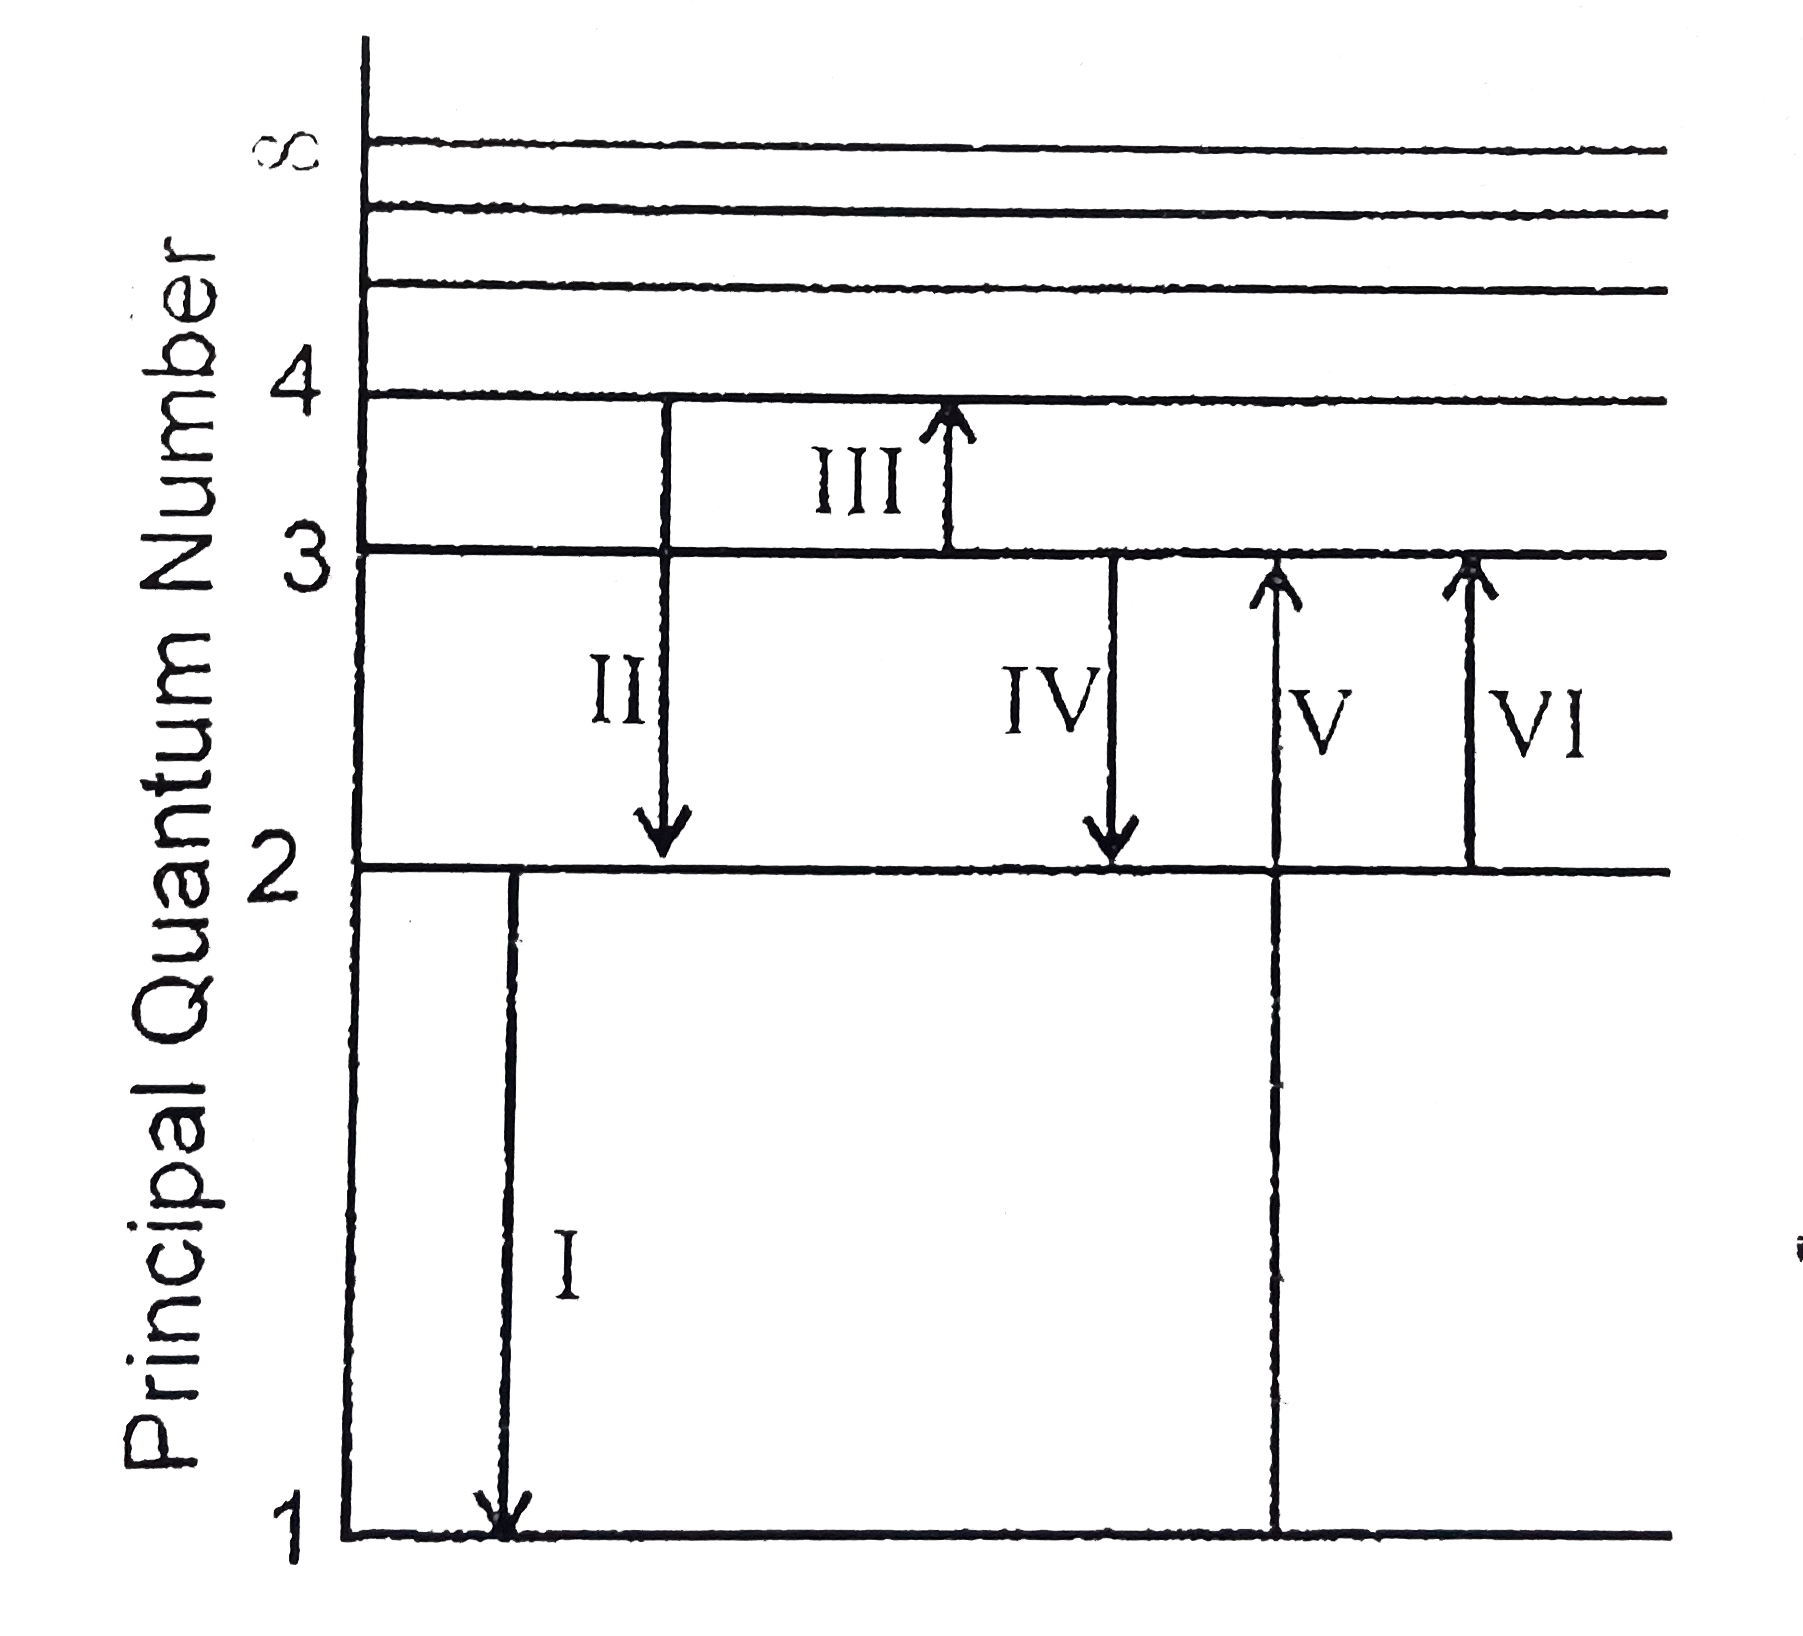
The figure shows an energy level diagram for the hydrogen atom. Several transitions are marked as I, II, III,_____. The diagram is only indicative and not be scale.

Which transition will occur when a hydrogen atom is irradiated with radiation of wavelength 103nm.AIBIICIVDVThe figure shows an energy level diagram for the hydrogen atom. Several transition are marked as I, II, III, …………. The diagram is only indicative and not to scale.
 AThe transition in which a Balmer series photon absorbed is VIBThe wavelength of the radiation involved in transition II is 486 nmCIV transition will occur when a hydrogen atom is irradiated with radiation of wavelength 103nmDIV transition will emit the longest wavelength line in the visible portion of the hydrogen spectrum
The figure shows an energy level diagram for the hydrogen atom. Several transitions are marked as I,II,III ,______, the diagram is only indicative and not to scale.
_E01_150_Q01.png) .
.
Which transition involves the longest wavelength line in the visible portion of the hydrogen spectrumAIIBIIICVIDIV
(a) Name different series of lines observed in hydrogen spectrum.
(b) Draw energy level diagram of hydrogen atom.
View SolutionThe figure shows an energy level diagram for the hydrogen atom. Several transitions are marked as I, II, III,_____. The diagram is only indicative and not be scale.

Which transition will occur when a hydrogen atom is irradiated with radiation of wavelength 103nm.
View SolutionThe figure shows an energy level diagram for the hydrogen atom. Several transitions are marked as I, II, III,_____. The diagram is only indicative and not be scale.

Which transition will occur when a hydrogen atom is irradiated with radiation of wavelength 103nm.
View SolutionThe figure shows an energy level diagram for the hydrogen atom. Several transitions are marked as I,II,III ,______, the diagram is only indicative and not to scale.
_E01_150_Q01.png) .
.
Which transition involves the longest wavelength line in the visible portion of the hydrogen spectrum
View SolutionDraw the energy-level diagram of hydrogen atom. Show the Lyman series and Pfund series in the diagram.
View Solution
