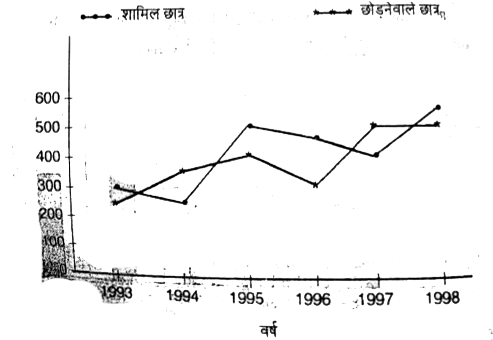
वर्ष 1993 से 1998 तक प्रत्येक वर्ष के प्रारम्भ में एक स्कूल में शामिल होने वाले तथा स्कूल छोड़ने वाले छात्रों की संख्या
स्कूल में 1992 में छात्रों की संख्या = 1500

वर्ष 1996 में स्कूल में कितने छात्र थे ।
The correct Answer is:
Topper's Solved these Questions
- ग्राफBOOK - MAHESH MISHRACHAPTER - ग्राफEXERCISE - 29 B प्रतियोगी परीक्षाओं में पूछे गए प्रश्न
74 Videos
- ग्राफBOOK - MAHESH MISHRACHAPTER - ग्राफEXERCISE - 29 C प्रतियोगी परीक्षाओं हेतु अभ्यास प्रश्नमाला
71 Videos
- क्रमचय और संचयBOOK - MAHESH MISHRACHAPTER - क्रमचय और संचयEXERCISE - 26 C (प्रतियोगी परीक्षाओं हेतु अभ्यास प्रश्नमाला)
35 Videos
- घातांक एंव करणीBOOK - MAHESH MISHRACHAPTER - घातांक एंव करणीEXERCISE - 4 C (प्रतियोगी परीक्षाओं हेतु अभ्यास प्रश्नमाला)
90 Videos
Similar Questions
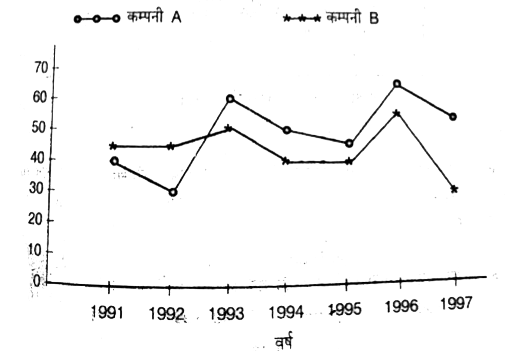
दो कम्पनियोंA और B का विभिन्न वर्षों में शुद्ध लाभ का प्रतिशत

यदि 1992 में कम्पनी B की कुल आय 140 करोड़ रुपये थी, तब उस वर्ष उसका कुल खर्च (करोड़ रुपये में) क्या था ?
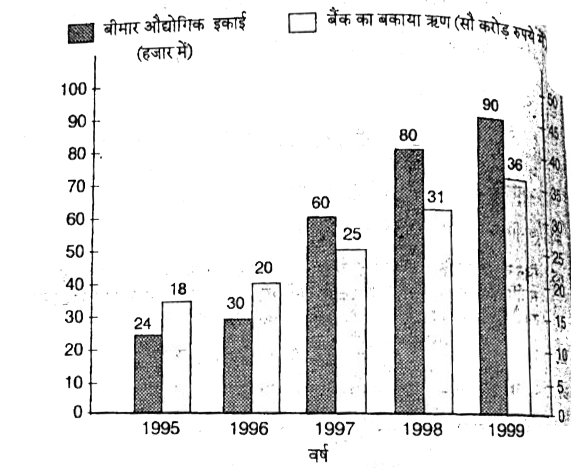
View Solutionविभिन्न वर्षों में बीमार औद्योगिक इकाईयों की संख्या (×1000) तथा बैंक का बकाया ऋण (×100) करोड़ रुपये में

किस वर्ष बैंक का ऋण प्रति बीमार इकाई अधिकतम था ?
View Solution8 छात्र गणित विषय के, 7 छात्र विज्ञान के तथा 4 छात्र अंग्रेजी विषय के है। कितने तरीके से इन छात्रों को स्कॉलरशिप दिए जा सकते हैं यदि यह सर्वोच्च स्थान प्राप्त करनेवालों को ही दिया जाता है ?
View Solution81√0.04=?
View Solutionयह ज्ञात है की महाविद्यालय के छात्रों में से 60 % छात्रावास में रहते है और 40 % छात्रावास में नहीं रहते है । पूर्ववर्ती वर्ष से परिणाम सूचित करते है की छात्रावास में रहने वाले छात्रों में से30 % छात्रों में से 20 % छात्रों ने A ग्रेड लिए। वर्ष के अंत में महाविद्यालय के एक छात्र को यादृच्छया चुना गया और पाया गया की उसे A ग्रेड मिला है । इस बात की क्या प्रायिकता है की वह छात्रावास में रहने वाला है ?
View Solutionबड़ौदा का बोर्डिंग स्कूल में मकबूल की दोस्ती कितने लड़कों से होती है?
View SolutionIn a school, 512 of the number of students are girls and the rest are boys, 47 of the number of boys are below 14 years of age, and 25 of the number of girls are 14 years or above 14 years of age. If the number of students below 14 years of age is 1120, then the total number in the school is:
एक स्कूल में, छात्रों की संख्या में से 512 लड़कियाँ हैं और बाकी लड़के हैं, जिनमें से 47 लड़कों की संख्या 14 वर्ष से कम है, और 25 की संख्या में लड़कियाँ 14 वर्ष या 14 वर्ष से अधिक हैं। यदि 14 वर्ष से कम आयु के छात्रों की संख्या 1120 है, तो स्कूल में कुल संख्या है:
View SolutionA certain number of students from school X appeared in an examination and 30% students failed. 150% more students than those from school X, appeared in the same examination from school Y. If 80% of the total number of students who appeared from X and Y passed, then what is the percentage of students who failed from Y ?
एक परीक्षा में स्कूल X के कुछ छात्र उपस्थित हुए और 30% छात्र फेल हो गए। स्कूल X के छात्रों की तुलना में 150% अधिक छात्र, स्कूल Y से उसी परीक्षा में उपस्थित हुए। यदि X और Y से उपस्थित होने वाले छात्रों की कुल संख्या का 80% उत्तीर्ण हो गया, तो Y से फेल हुए छात्रों का प्रतिशत क्या है?
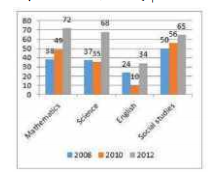
View SolutionThe given bar graph shows the number of marks scored by a student in each subject in three years.
दिया गया दंड आरेख एक छात्र के द्वारा तीन वर्षो में प्रत्येक विषय में लाये गए अंकों को दर्शाता है | In the given chart, the number of marks in social studies in 2012 is 13% of the school strength. The number of students is:
दिए गए चार्ट में, यदि वर्ष 2012 में सामाजिक अध्ययन में अंकों की संख्या स्कूल की के छात्रों की संख्या का 13% है। छात्रों की संख्या कितनी है?
View SolutionThe table below shows the number of students enrolled in five colleges over the five years (2010 to 2014). यह तालिका पांच कॉलेजों में पांच वर्षों ( 2010 से 2014 ) के दौरान नामांकन लेने वाले छात्रों की संख्या दर्शाती है | In the year 2014, what percent of students were enrolled in college C (correct to one decimal place)? वर्ष 2014 में, कितने प्रतिशत छात्रों ने कॉलेज C में नामांकन करवाया था ? ( एक दशमलव स्थान तक )
View SolutionThis table shows the number of students studying in various streams in different colleges. निम्नलिखित तालिका पांच कॉलेजों के तीन विषयों में पढ़ने वाले छात्रों की संख्या दर्शाती है | The number of students in the science stream of college C is approximately what percentage of students studying in that college? कॉलेज C में विज्ञान विषय में छात्रों की संख्या उस कॉलेज में पढ़ने वाले छात्रों की संख्या का लगभग कितना प्रतिशत है ?
View SolutionThe given Bar Graph presents the number of students of two schools for six years. दिया गया दंड आरेख छः वर्ष की अवधि में दो विद्यालयों में छात्रों की संख्या को दर्शाता है | In which year, the absolute difference between the numbers of students in two schools is the highest? किस वर्ष में, दोनों विद्यालयों में छात्रों की संख्या के बीच पूर्ण अंतर सबसे अधिक है ?
View SolutionThe given Bar Graph presents the number of students of two schools for six years. दिया गया दंड आरेख छः वर्ष की अवधि में दो विद्यालयों में छात्रों की संख्या को दर्शाता है | In which year, the percentage increase in students in school B is the highest in comparison to its previous year? किस वर्ष में, विद्यालय B में छात्रों की संख्या में प्रतिशत वृद्धि इसके पिछले वर्ष की तुलना में सबसे अधिक रही है?
View SolutionThe given Bar Graph presents the number of students of two schools for six years. दिया गया दंड आरेख छः वर्ष की अवधि में दो विद्यालयों में छात्रों की संख्या को दर्शाता है | In which year, the percentage increase of students in school A is the highest in comparison to its previous year? किस वर्ष, विद्यालय A में छात्रों की संख्या में प्रतिशत वृद्धि पिछले वर्ष की तुलना में सर्वाधिक है ?
View SolutionThe given Bar Graph presents the number of students of two schools for six years. दिया गया दंड आरेख छः वर्ष की अवधि में दो विद्यालयों में छात्रों की संख्या को दर्शाता है | What is the ratio of the number of students taken together for the years 2008, 2012 and 2013 in School A to the number of students taken together for the years 2008, 2012 and 2013 in school B? विद्यालय A में 2008, 2012 तथा 2013 को मिलाकर छात्रों की संख्या का विद्यालय B में 2008, 2012 तथा 2013 को मिलाकर होने वाले छात्रों की संख्या के साथ अनुपात ज्ञात करें |
View SolutionThe given Bar Graph presents the results in terms of the number of students in a school for the five academic years, 2013-2014 to 2017-2018. दिया गया दंड आरेख पांच शैक्षणिक वर्षों : 2013-2014 से 2017-2018 तक एक विद्यालय में छात्रों की संख्या के संदर्भ में परिणामों को प्रस्तुत करता है | In which academic year the difference between the number of students passed and that of those failed is the lowest? किस शैक्षणिक वर्ष में, पास करने वाले छात्रों तथा फेल करने वाले छात्रों की संख्या में सबसे कम अंतर है ?
View Solution
