The following histogram shows the weight of the students of class X in a school on a particular day. Total number of students enrolled in the class X = 200.
निम्नलिखित हिस्टोग्राम किसी एक दिन पर एक स्कूल में दसवीं कक्षा के छात्रों के वजन को दर्शाता है। कक्षा
- 200 में नामांकित कुल छात्र।

The number of students weighing less than 55kg is what percentage less than the number of students
weighing 55kg to 65kg?
55 किग्रा से कम वजन वाले छात्रों की संख्या 55 किग्रा से किग्रा तक वाले छात्रों की संख्या से कितने प्रतिशत काम है ज्ञात करे |
0.08
0.05
0.1
0.07
Step by step video & image solution for The following histogram shows the weight of the students of class X in a school on a particular day. Total number of students enrolled in the class X = 200. निम्नलिखित हिस्टोग्राम किसी एक दिन पर एक स्कूल में दसवीं कक्षा के छात्रों के वजन को दर्शाता है। कक्षा - 200 में नामांकित कुल छात्र। The number of students weighing less than 55kg is what percentage less than the number of students weighing 55kg to 65kg? 55 किग्रा से कम वजन वाले छात्रों की संख्या 55 किग्रा से किग्रा तक वाले छात्रों की संख्या से कितने प्रतिशत काम है ज्ञात करे | by Maths experts to help you in doubts & scoring excellent marks in Class 14 exams.
Updated on:21/07/2023Topper's Solved these Questions
Similar Questions
The given graph shows the weights of students in a school on a particular day.
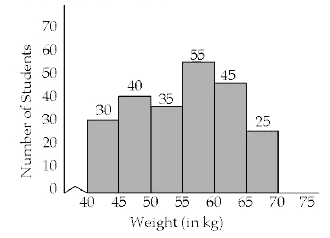
The number of students weighing less than 50kg is what percent less than the number of students weighing 55kg or more?
View SolutionThe given graph shows the weights of students in a school on a particular day.
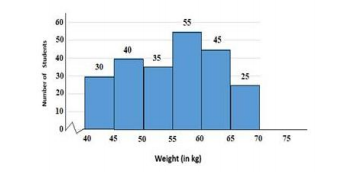 The number of students weighing less than 50 kg is what per cent less than the number of students weighing 55 kg or more?
View Solution
Knowledge Check
In a class, 5% students are absent on a particular day. If the number of students present on that day is 38 , the total strength of the class is :
A45B50C40D33Study the given histogram that shows the marks obtained by students in examination and answer the question that follows
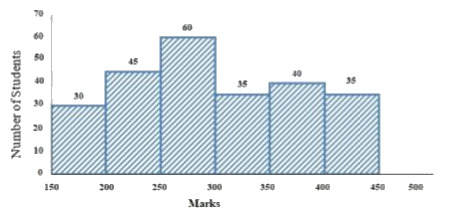
The number of students who obtained less than 200 marks is :AA)45BB)135CC)30DD)75
The following histogram shows the weights of students of class X in a school on a particular day. Total number of students enrolled in class X = 200.
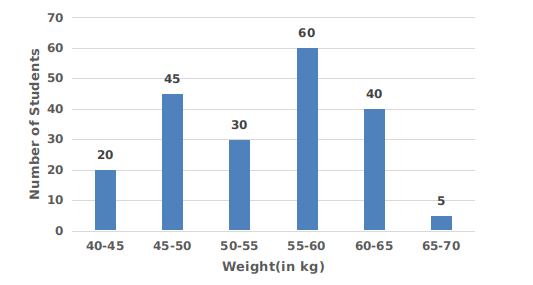
The number of students weighing less than 55 kg is what percentage less than the number of students weighing 55 kg to 65 kg?
View SolutionThe given graph shows the marks obtained by students in an examination.
दिया गया आरेख किसी परीक्षा में छात्रों के प्राप्तांक दर्शाता है |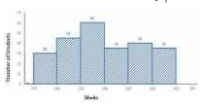 The number of students who obtained less than 300 marks is what percent more than the number of students who obtained 350 or more marks?
300 अंक से कम प्राप्त करने वाले छात्रों की संख्या 350 या इससे अधिक अंक प्राप्त करने वाले छात्रों की संख्या से कितना प्रतिशत अधिक है ?
View SolutionThe following pie chart shows the percentage wise distribution of the number of students in five different schools, P, Q, R, S and T. Total number of students in all five schools together is 8400.
निम्नलेखित पाई चार्ट पाँच अलग-अलग स्कूलों, P, Q, R, Sऔर T में छात्रों की संख्या का प्रतिशत वार वितरण दर्शाता है। सभी पाँच स्कूलों में कुल छात्रों की संख्या 8400 है।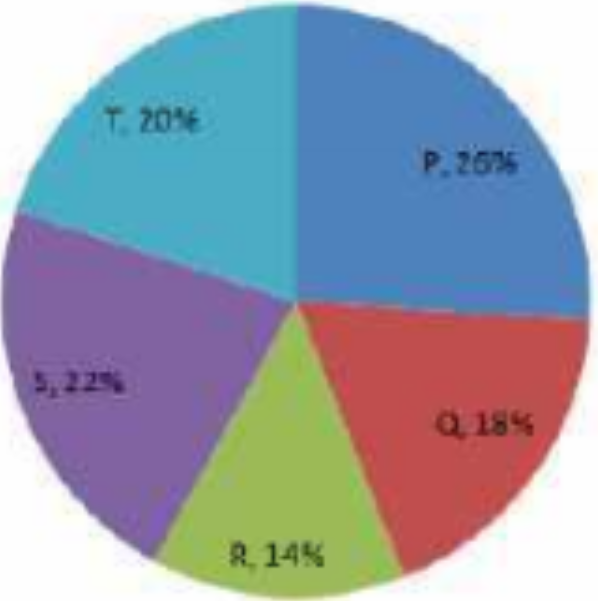 The number of students in school T is what percentage of the total number of students in school Q and S together.
स्कूल T में छात्रों की संख्या, स्कूल Q और S में कुल छात्रों की संख्या का कितना प्रतिशत है?
View SolutionThe given histogram shows the height of the students:
दिए गए हिस्टोग्राम छात्रों की लम्बाई को दर्शाता है
The number of students whose height is in the class interval 165-170 is what percentage less than the number of students whose height is in the interval 150-155?
कक्षा अंतराल 165-170 में जिन छात्रों की लम्बाई है, उन छात्रों की संख्या प्रतिशत में कितना कम है लम्बाई अंतराल 150-155 से ज्ञात करे |
View SolutionThis table shows the number of students studying in various streams in different colleges.
निम्नलिखित तालिका पांच कॉलेजों के तीन विषयों में पढ़ने वाले छात्रों की संख्या दर्शाती है | The number of students in the science stream of college C is approximately what percentage of
students studying in that college?
कॉलेज C में विज्ञान विषय में छात्रों की संख्या उस कॉलेज में पढ़ने वाले छात्रों की संख्या का लगभग कितना प्रतिशत है ?
View SolutionThe following pie chart shows the percentage-wise distribution of the number of students in five different schools P, Q, R, S and T. The total number of students in all five schools together is 8400.
निम्नलिखित पाई चार्ट पांच अलग-अलग स्कूलों P, Q, R, S और T में छात्रों की संख्या के प्रतिशत को दर्शाता है। सभी पाँच स्कूलों में कुल छात्रों की संख्या 8400 है Find the average number of students in schools R and S together.
स्कूलों R और S में एक साथ छात्रों की औसत संख्या ज्ञात कीजिए।
View Solution
