प्राकृतिक गैस का विभिन्न राज्यों में उत्पादन तथा उन राज्यों में उसकी मांग (लाख घन मीटर में)
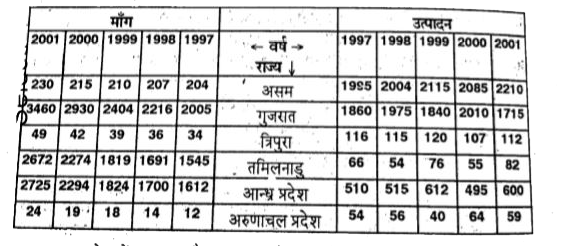
सभी वर्षो में तमिलनाडु में प्राकृतिक गैस का कुल उत्पादन, त्रिपुरा में सभी वर्षो में उसके कुल उत्पादन का लगभग कितना प्रतिशत है ?
The correct Answer is:D
Step by step video & image solution for प्राकृतिक गैस का विभिन्न राज्यों में उत्पादन तथा उन राज्यों में उसकी मांग (लाख घन मीटर में) सभी वर्षो में तमिलनाडु में प्राकृतिक गैस का कुल उत्पादन, त्रिपुरा में सभी वर्षो में उसके कुल उत्पादन का लगभग कितना प्रतिशत है ? by Maths experts to help you in doubts & scoring excellent marks in Class 14 exams.
Updated on:21/07/2023Topper's Solved these Questions
Similar Questions
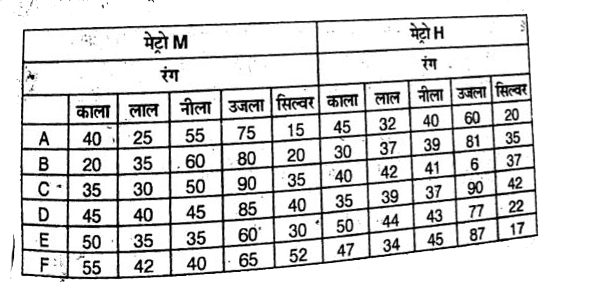
दोनों मेट्रो शहरो में किस नमूना के उजले रंग के कारो की बेचीं गयी संख्याओं में अंतर न्यूनतम है ?
View Solution400 रु. को राशि पर 5% वार्षिक दर से 73 दिनों का साधारण ब्याज क्या होगा ?
View Solutionऔद्योगिक उत्पादन में सूक्ष्मजीव
View SolutionThe average Kharif production of the given years is- दिए गए वर्षों में खरीफ का फसलों का औसत उत्पादन कितना है?
View SolutionThe table shows the production of different types of cars (in thousands)
यह तालिका अलग-अलग प्रकार के कारों का उत्पादन ( हज़ार में ) दर्शाती है |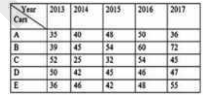 The total production of cars of types B in 2013, 2014, 2015 and 2017 taken together is what
percent less than the total production of all types of cars in 2017? (correct to one decimal place)
2013, 2014, 2015 और 2017 में B प्रकार की कारों का कुल उत्पादन 2017 में सभी प्रकार की कारों के कुल उत्पादन से कितना प्रतिशत कम है ?
View SolutionThe table shows the production of different types of cars (in thousands)
यह तालिका अलग-अलग प्रकार के कारों का उत्पादन ( हज़ार में ) दर्शाती है |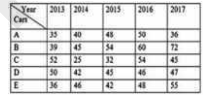 The production of cars of type A in 2015 and of type C in 2013 taken together is approximately what percent of the total production of cars of type D in five years?
2015 में A प्रकार की कारों का उत्पादन तथा 2013 में C प्रकार की कारों के उत्पादन को मिला दिया जाए, तो ये पांच वर्षों में D प्रकार की कारों के कुल उत्पादन का लगभग कितना प्रतिशत है ?
View SolutionThe table shows the production of different types of cars (in thousands).
 The total production of type C cars in 2015 and type E cars in 2018 taken together is what percent of the total production of cars in 2014 and 2017 taken together?
2015 में C तथा 2018 में E प्रकार की कारों का कुल उत्पादन एक साथ 2014 तथा 2017 में कारों के कुल उत्पादन का कितना प्रतिशत है ?
View SolutionThe table shows the production of different types of cars (in thousands).
यह तालिका एक कंपनी द्वारा अलग-अलग कारों के उत्पादन ( हज़ार में ) को दर्शाती है |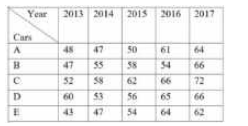 The total production of type B cars during 2013 to 2016 is approximately what percent less than the total production of cars in 2017?
2013 से 2016 के दौरान B प्रकार की कारों का कुल उत्पादन 2017 में कारों के कुल उत्पादन से लगभग कितना प्रतिशत कम है ?
View SolutionThe table shows the production of different types of cars (in thousands).
यह तालिका एक कंपनी द्वारा अलग-अलग कारों के उत्पादन ( हज़ार में ) को दर्शाती है |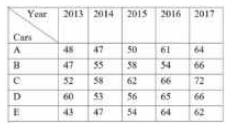 The total production of type B cars in 2015 and type C cars in 2013 is what percent more than the total production of type E cars in 2013 and 2014 ? (Correct to one decimal place)
2015 में B प्रकार तथा 2013 में प्रकार की कारों का कुल उत्पादन 2013 तथा 2014 में E प्रकार की कारों के कुल उत्पादन से कितना प्रतिशत अधिक है ? (एक दशमलव स्थान तक)
View SolutionThe table shows the production of different types of cars (in thousands).
यह तालिका एक कंपनी द्वारा अलग-अलग कारों के उत्पादन (हज़ार में ) को दर्शाती है |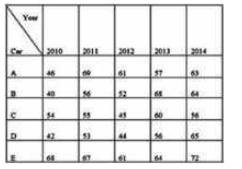 The average production of all type of cars in 2014 is approximately what percent less than the total production of type B cars in 2013 and type D cars in
2010 taken together?
2014 में सभी प्रकार की कारों का औसत उत्पादन 2013 में B प्रकार तथा 2010 में D प्रकार की कारों के कुल उत्पादन से लगभग कितना प्रतिशत कम है ?
View SolutionTable shows the production of rice (in million tonnes) of three states over six years. यह तालिका तीन राज्यों में छः वर्षों में दौरान चावल के उत्पादन ( मिलियन टन में ) को दर्शाती है | What is the ratio of the production of rice in all three states in the year 2014 to that in 2016? सभी तीन राज्यों में वर्ष 2014 तथा 2016 में उत्पादित चावल की मात्रा में अनुपात ज्ञात करें |
View SolutionThe table given below presents the figures of the production (in thousands) of different types of vehicles by a company during the year 2013-18.
नीचे दी गयी तालिका वर्ष 2013-18 के दौरान एक कंपनी के द्वारा विभिन्न प्रकार के वाहनों के उत्पादन ( हज़ार में)के आंकड़ों को प्रस्तुत करती है |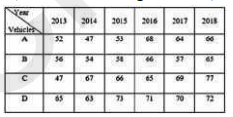 The total production of all types of vehicles in 2018 is what percent more than the total production of all types of vehicles in 2015?
2018 में सभी प्रकार के वाहनों का कुल उत्पादन 2015 में सभी प्रकार के वाहनों के कुल उत्पादन से कितना प्रतिशत अधिक है ?
View SolutionIn which state the largest number of Kesar is produce - किस राज्य में सबसे अधिक मात्रा में केसर का उत्पादन किया जाता है?
View SolutionThe percentage of the total production of flavour R in 2007 and 2008 with respect to the production of flavour P in 2005 and 2006 is : वर्ष 2007 तथा 2008 में गन्ध R का कुल उत्पादन, वर्ष 2005 तथा 2006 में गन्ध P के उत्पादन की तुलना में कितने प्रतिशत रहा है?
View Solutionनिम्नलिखित में से कौन सा संयोजन H2 गैस का उत्पादन करेगा?
View Solutionबोश प्रक्रम का उपयोग हाइड्रोजन गैस के उत्पादन के लिए किया जाता है, दी गई गैस में से किस गैस का उपयोग इसके लिए किया जाता है
View Solution
