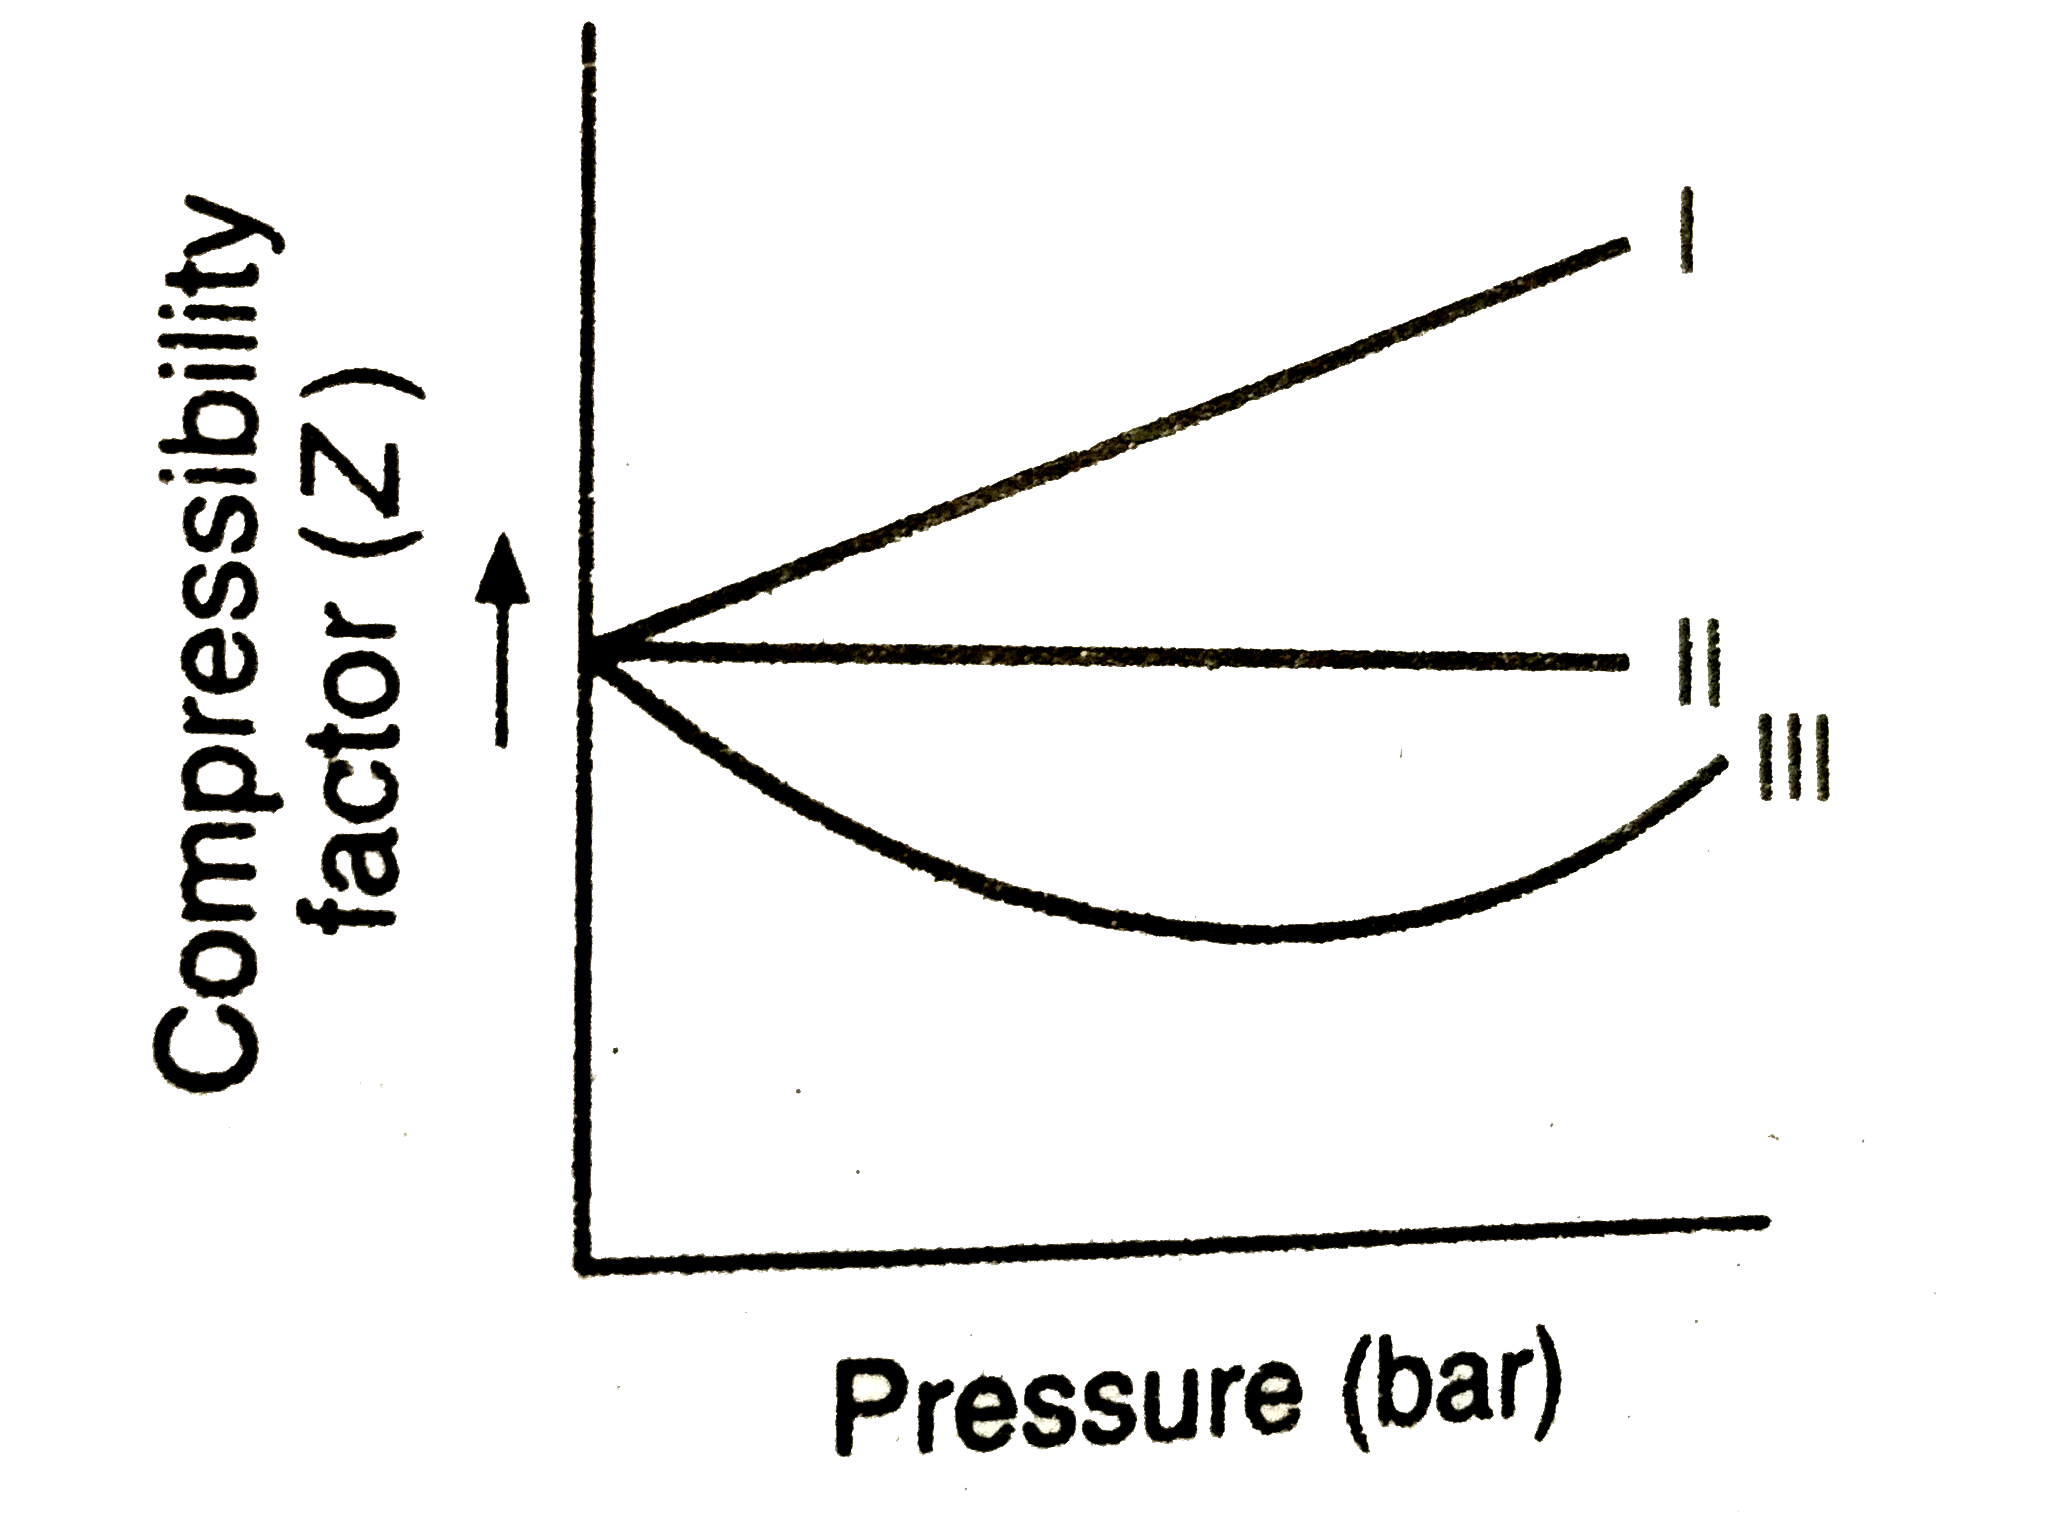
The Boyle temperature of three gases are given in the table :
{:("Gas","Boyle Temperature (K)",),
("Ethene",735,),
("Oxygen",400,),
("Hydrogen",110,) :}
If the compressibility factor was measured at 400 K, the gases are :

I-ethene, II-oxygen,III-hydrogen
I-hydrogen,II-ethene,III-oxygen
I-hydrogen,II-oxygen,III-ethene
I-oxygen,II-ethene,III-hydrogen
The correct Answer is:C
Conceptual Oxygen most ideal at 400K. Hydrogen most non ideal
Topper's Solved these Questions
- BOOK - ALLENCHAPTER - TEST PAPERSEXERCISE - CHEMISTRY25videos
TEST PAPERS
- BOOK - ALLENCHAPTER - TEST PAPERSEXERCISE - MATHEMATICS2videos
TEST PAPERS
- BOOK - ALLENCHAPTER - TEST PAPERSEXERCISE - part-2 Chemisty18videos
TEST PAPERS
- BOOK - ALLENCHAPTER - TEST PAPER 4EXERCISE - CHEMISTRY45videos
TEST PAPER 4
- BOOK - ALLENCHAPTER - THERMODYNAMICS EXERCISE - EXERCISE -418videos
THERMODYNAMICS
Similar Questions
Knowledge Check
- Question 1 - Select One
At Boyle's temperature , compressibility factor Z for a real gas is
A1B0C>1D<1
If the critical temperature of a gas is 300 K then the ratio of its inversion and Boyle's temperature will be
View SolutionBoyle temperature of vaiour gases are given below :
GasTB(K)H2117He23CH4498O2406
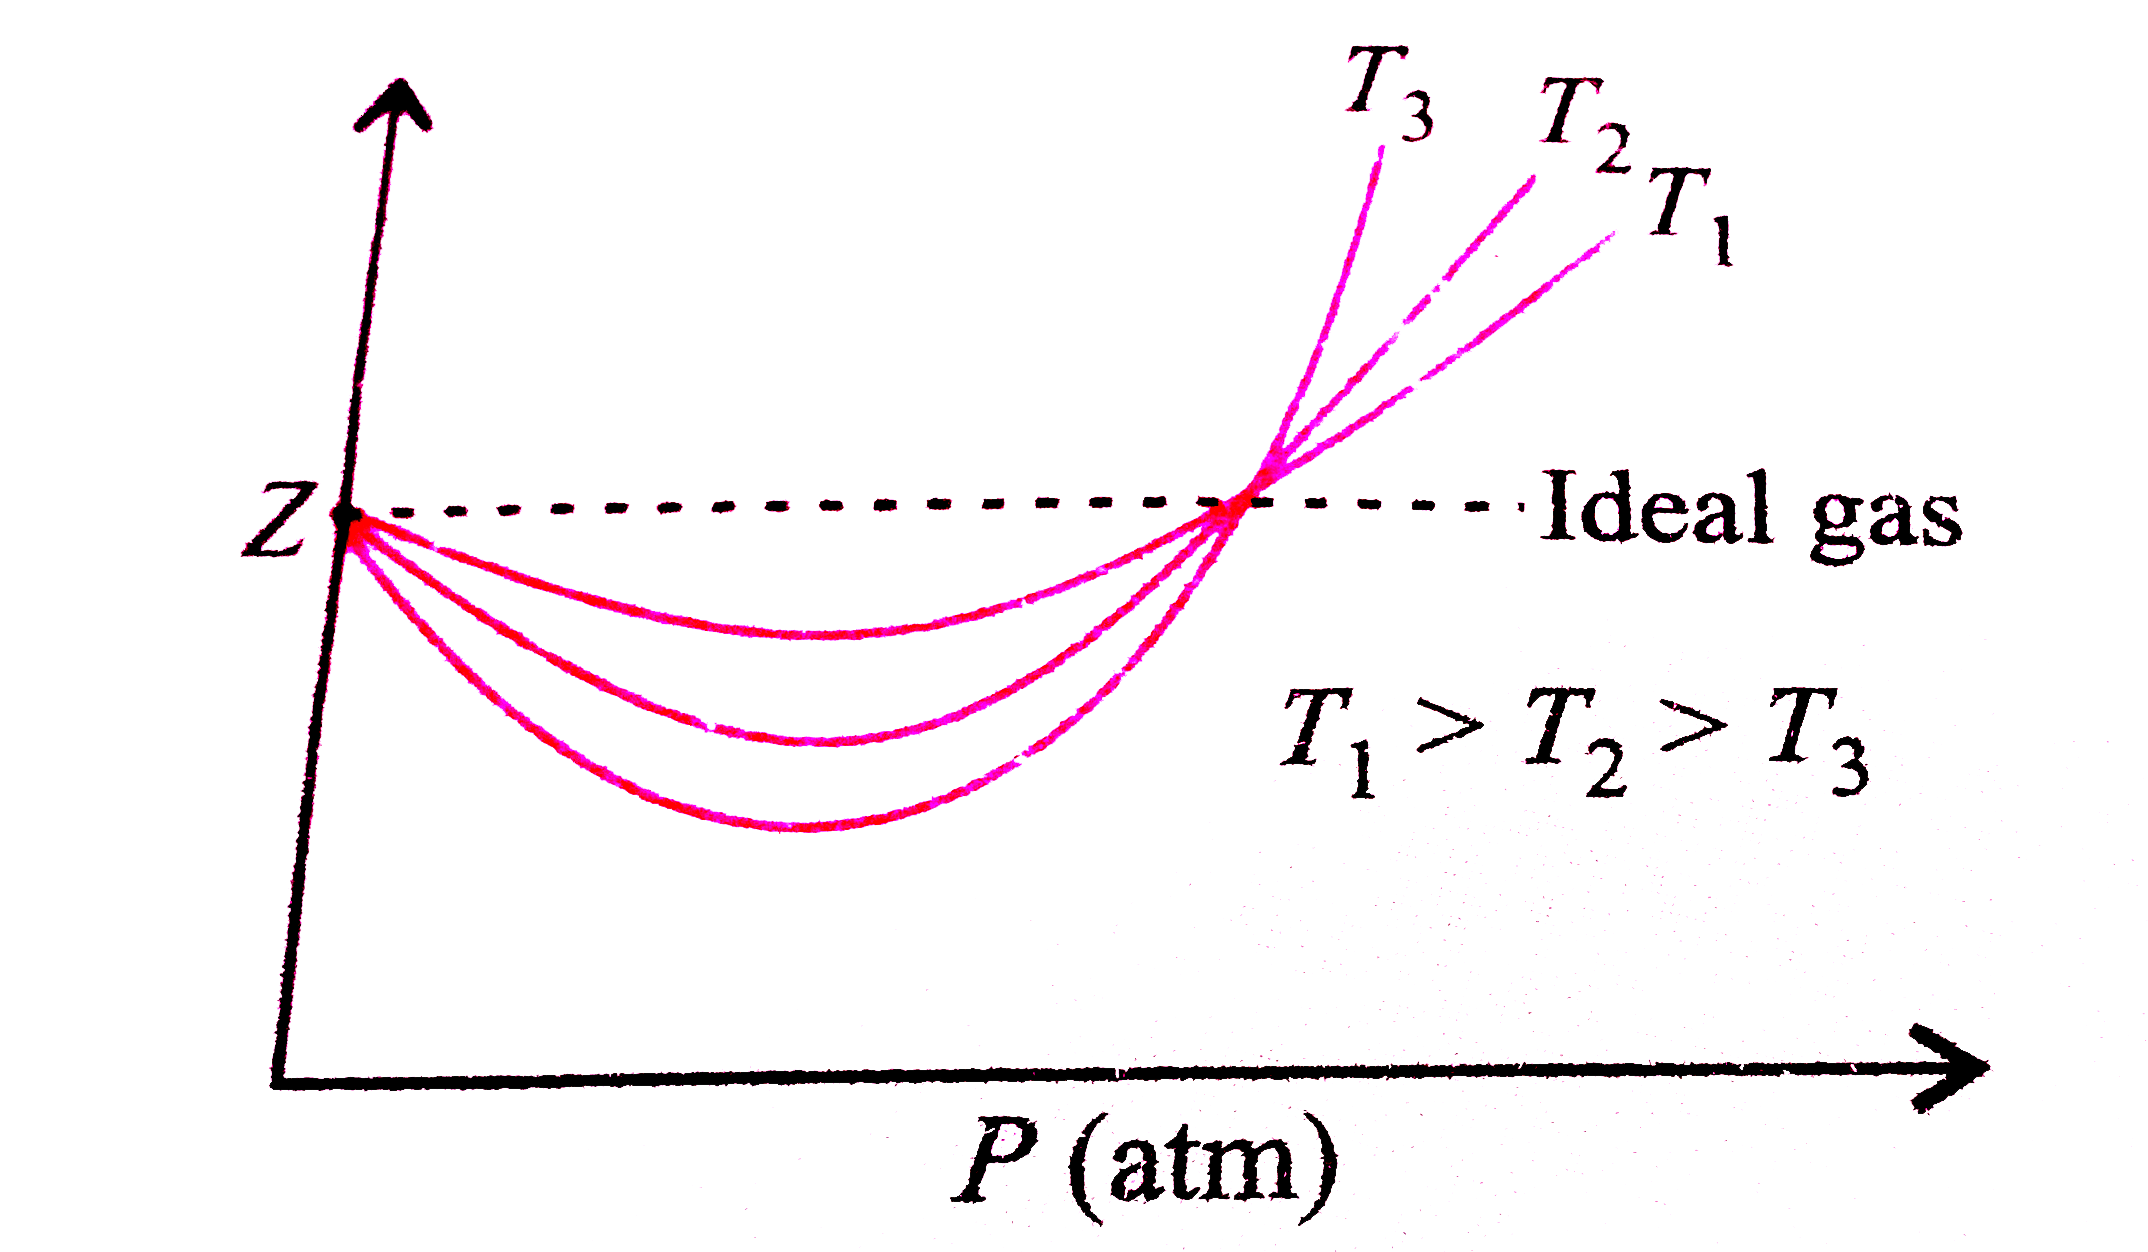
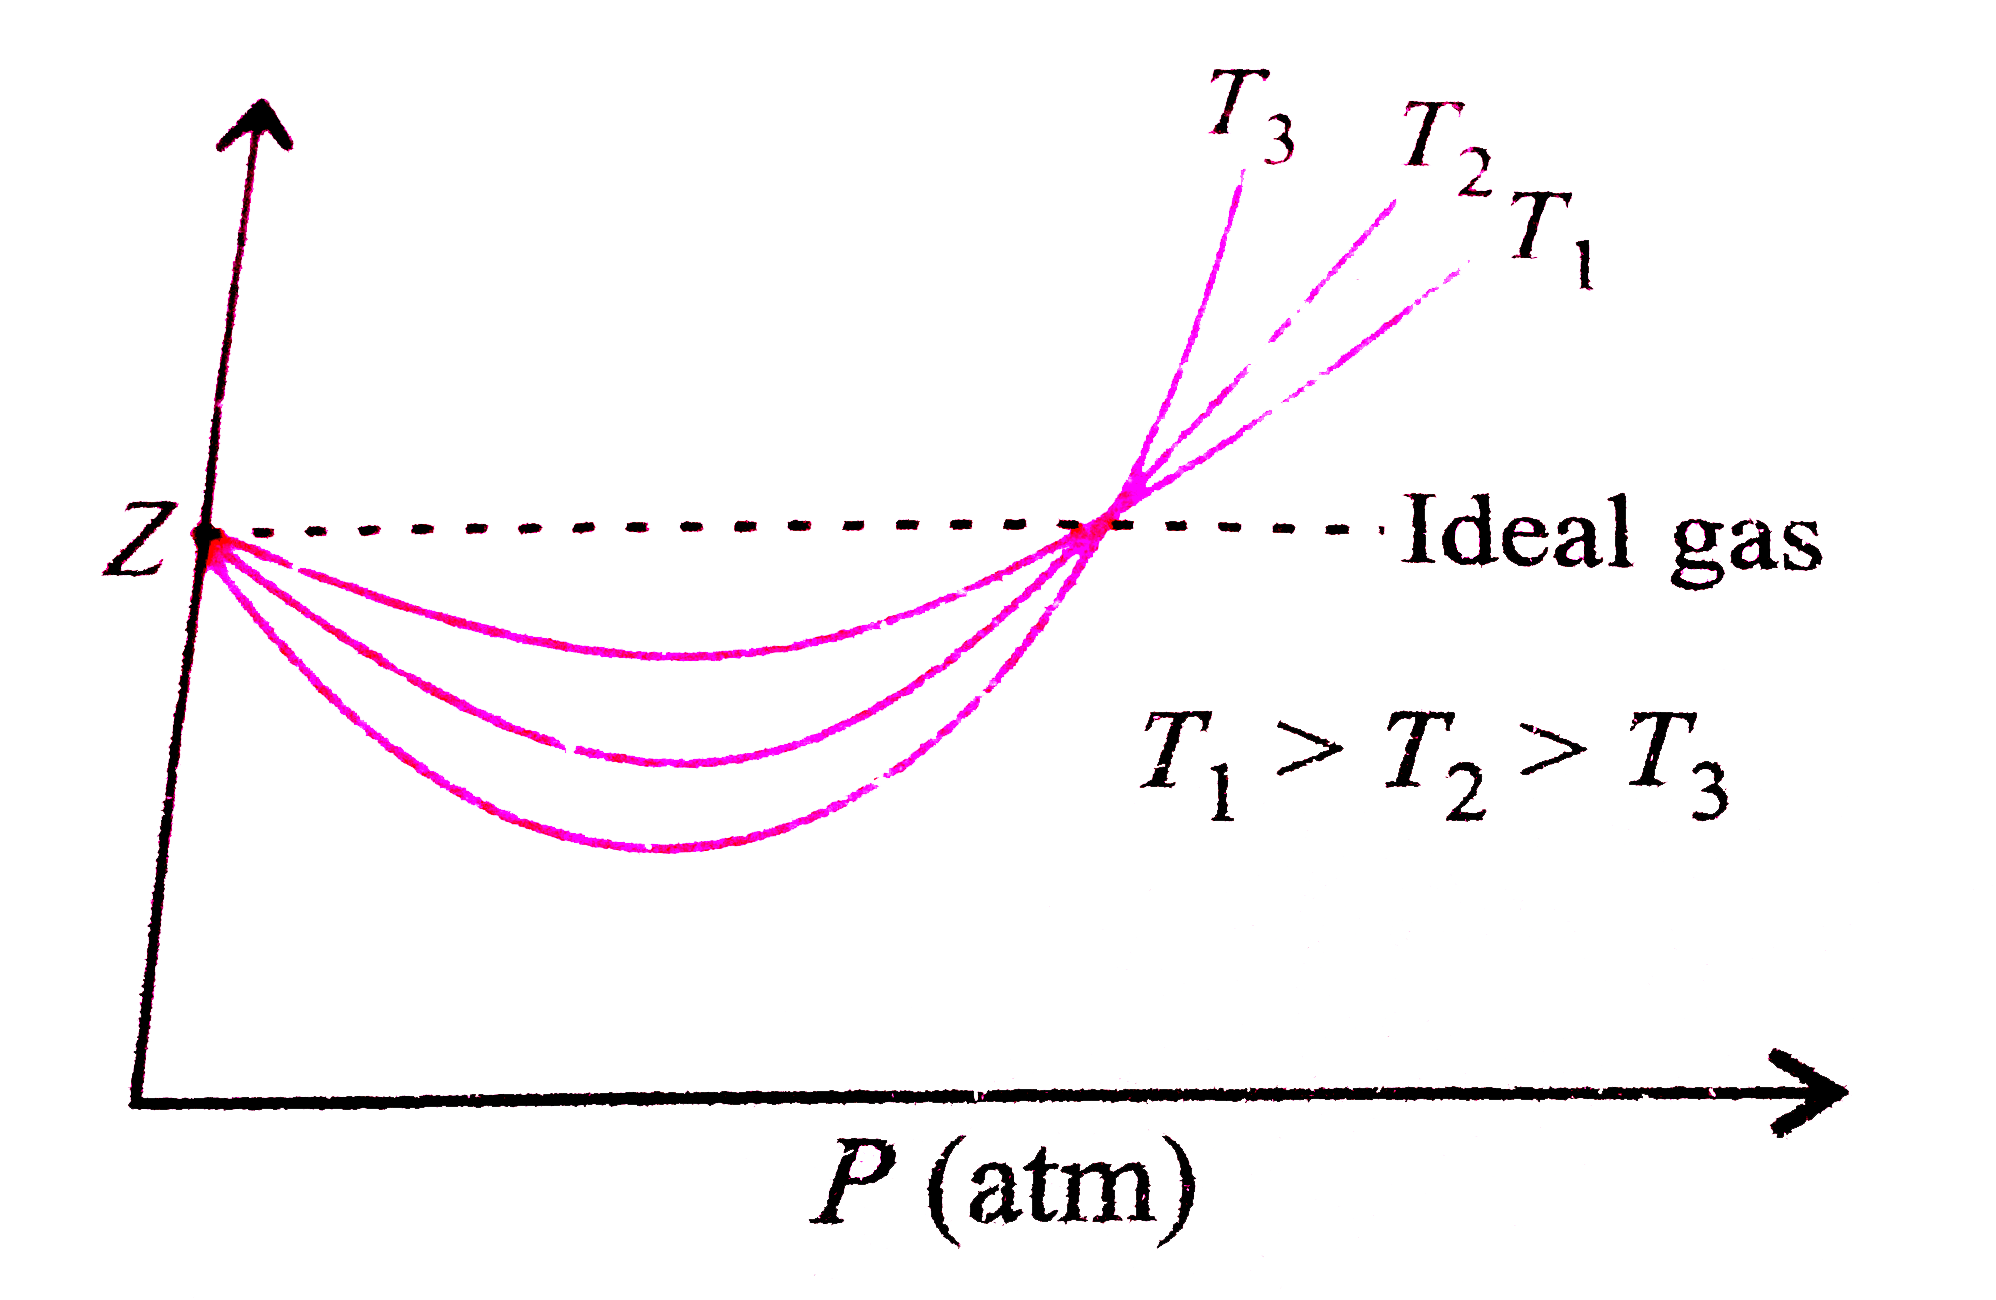
Which gas can be liquefied most easily ?View SolutionBoyle's temperature or Boyle point is the temperature at which a real gas starts behaving like an ideal gas over a particular range of pressure. A graph is plotted between compressibility factor Z and pressure P.

What is the deviation of real gas from ideal behaviour in terms of compressibility factor , Z ?View SolutionBoyle's temperature or Boyle point is the temperature at which a real gas starts behaving like an ideal gas over a particular range of pressure. A graph is plotted between compressibility factor Z and pressure P.

What is the variation of Z with pressure ?View SolutionThe temperature dependence of resistance of Cu and undoped Si in the temperature range 300−400K, is best described by :
View SolutionSketch shows the plot of Z vs P for 1 mol of a hypothetical gas at three distinct temperature.

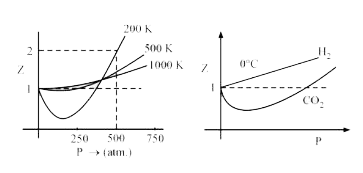
Boyle’s temperature is the temperature at which a gas shows ideal behaviour over a pressure range in the low pressure region. Boyle’s temperature (Tb)=aRb. If a plot is obtained at temperatures well below Boyle’s temperature then the curve will show negative deviation, in low pressure region and positive deviation in the high pressure region. Near critical temperature the curve is more like CO2 and the temperature well above critical temperature curve is more like H2 as shown above. At high pressure suppose all the constant temperature curve varies linearly with pressure according to the following equation: Z=1+PbRT(R=2calmol−1K−1)
For 500 K plot the value of Z changes from 2 to 2.2 if pressure is varied from 1000 atm to 1200 atm (high pressure) then the value of bRT will be :View SolutionThe temperature of a ideal gas is increased for 100 k to 400k. If at 100 K the root mea square velocity of the gas molecules is v, at 400K it becomes
View Solution


