For a simle pendulum, a graph is plotted between its kinetic energy (KE) and potential energy (PE) against its displacement d. Which one of the following represents these correctly ?
(Graphs are schematic and not drawn to scale)
_E01_144_O01.png)
_E01_144_O02.png)
_E01_144_O03.png)
_E01_144_O04.png)
The correct Answer is:D
Step by step video & image solution for For a simle pendulum, a graph is plotted between its kinetic energy (KE) and potential energy (PE) against its displacement d. Which one of the following represents these correctly ? (Graphs are schematic and not drawn to scale) by Physics experts to help you in doubts & scoring excellent marks in Class 12 exams.
Updated on:21/07/2023Topper's Solved these Questions
- SIMPLE HARMONIC MOTIONBook:ALLENChapter:SIMPLE HARMONIC MOTIONExercise:Exercise-05 [B]
Explore 12 Videos
- SIMPLE HARMONIC MOTIONBook:ALLENChapter:SIMPLE HARMONIC MOTIONExercise:MCQ s one or more than one correct answers
Explore 5 Videos
- SIMPLE HARMONIC MOTIONBook:ALLENChapter:SIMPLE HARMONIC MOTIONExercise:Exercise-04 [B]
Explore 105 Videos
- RACEBook:ALLENChapter:RACEExercise:Basic Maths (Wave Motion & Dopplers Effect) (Stationary waves & doppler effect, beats)
Explore 24 Videos
- TEST PAPERBook:ALLENChapter:TEST PAPERExercise:PHYSICS
Explore 4 Videos
Similar Questions
For a simple pendulum, a graph is plotted between itskinetic energy (KE) and potential energy (PE)against its displacement d. Which one of the following represents these correctly? (graph are schematic and not drawn to scale)
View SolutionWhich one of the following correctly represents an organism and its ecological niche?
View SolutionWhich of the following graph is correct between kinetic energy E, potential energy (U) and height (h) from the ground of the partical
View SolutionWhich of the following represents total kinetic energy of one mole of gas?
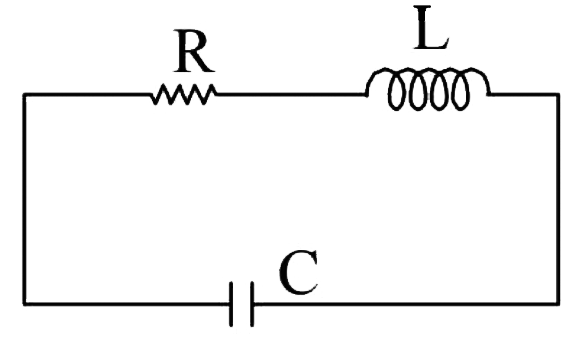
View SolutionA L-C-R circuit is equivalent to a damped pendulum . In an L-C-R circuit the capacitor is charged to Qo and then connected to the L and R as shown below.
If a student plots graph of the square of maximum charge on the capacitor with time (t) for two different values L1 and L2 (L1gtL2of L), then which of the following represents this graph correctly (plots are schematic and not drawn to scale)

View SolutionAn LCR curcuit is equivalent to a damped pendulum. In an LCR circuit the capacitor is charged to (Q0) and then connected to the L ans R as shown below.

If a student plaots graphs of the square of maximum charge (Q2max) on the capacitor with time (t) for two different values L1andL2(L1>L2) of L then which of the following represents this graph correclty? (plots are schematic and not drawn to scale).
View SolutionAn LCR curcuit is equivalent to a damped pendulum. In an LCR circuit the capacitor is charged to (Q0) and then connected to the L ans R as shown below.

If a student plaots graphs of the square of maximum charge (Q2max) on the capacitor with time (t) for two different values L1andL2(L1>L2) of L then which of the following represents this graph correclty? (plots are schematic and not drawn to scale).
View SolutionA body is thrown vertically upwards. Which one of the following graphs correctly represent the velocity vs time?
View SolutionA body executes simple harmonic motion. The potential energy (P.E), the kinetic energy (K.E) and energy (T.E) are measured as a function of displacement x. Which of the following staements is true?
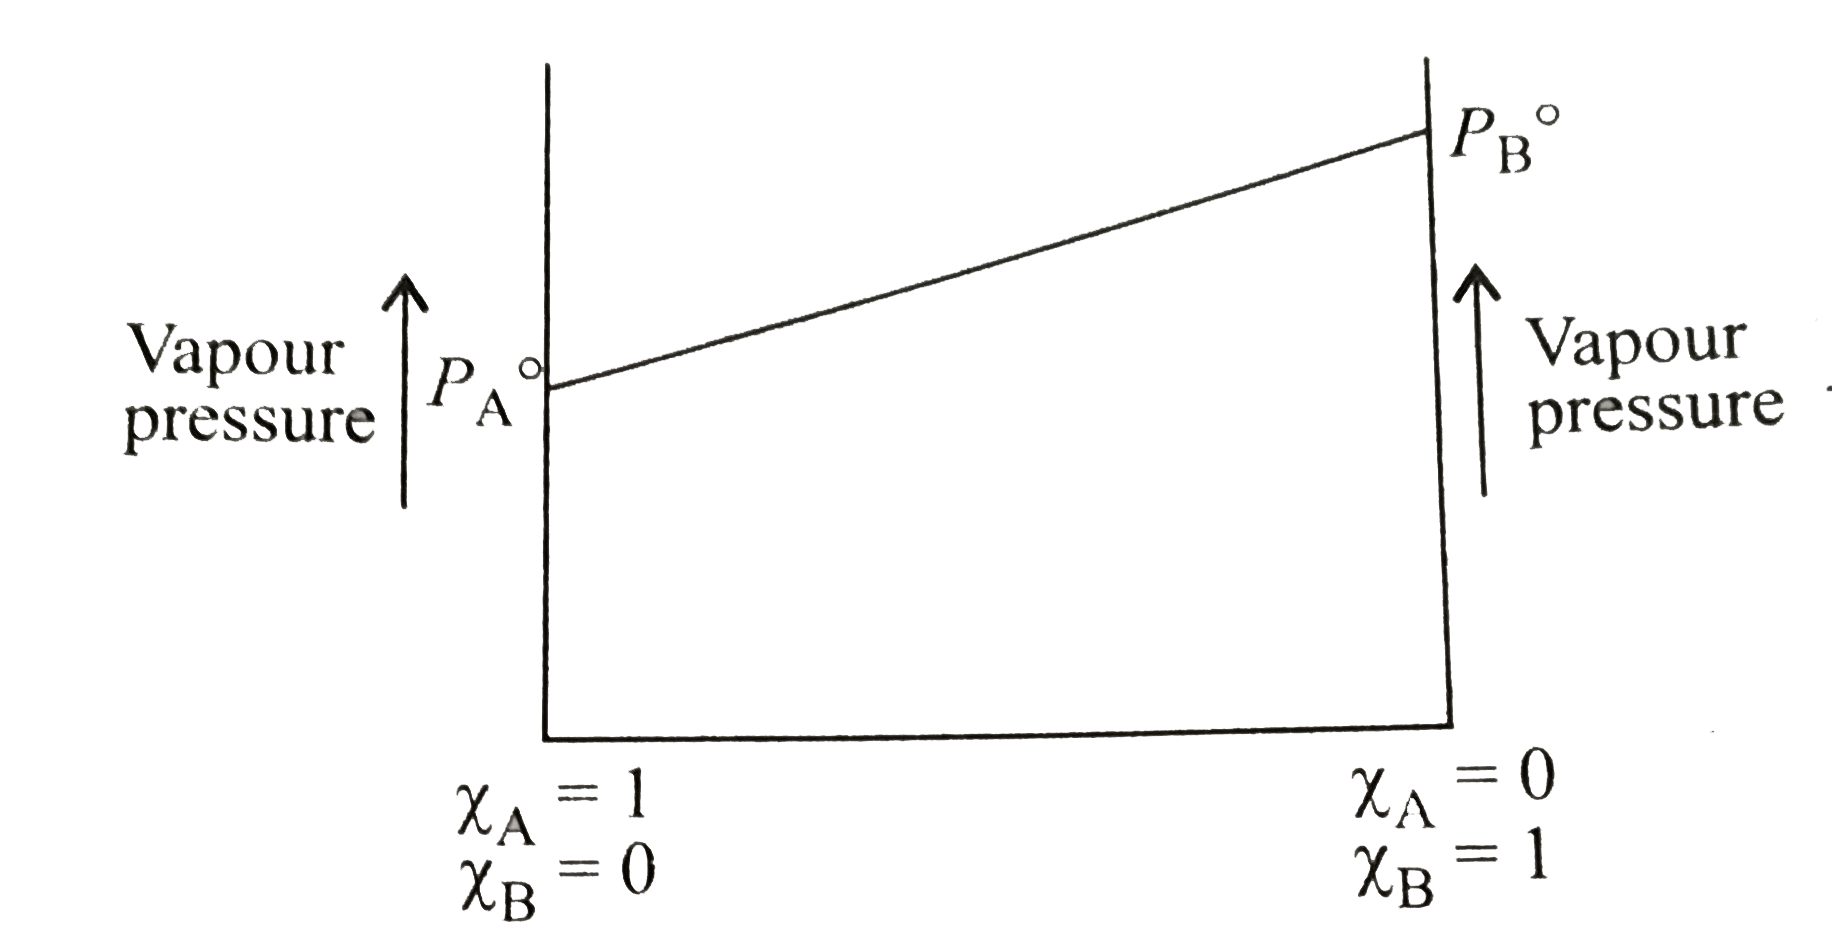
View SolutionThe following is a graph plotted between the vapour pressure of two volatile liquids against their respective mole fractions. Which of the following statements is/are correct?

View Solution
