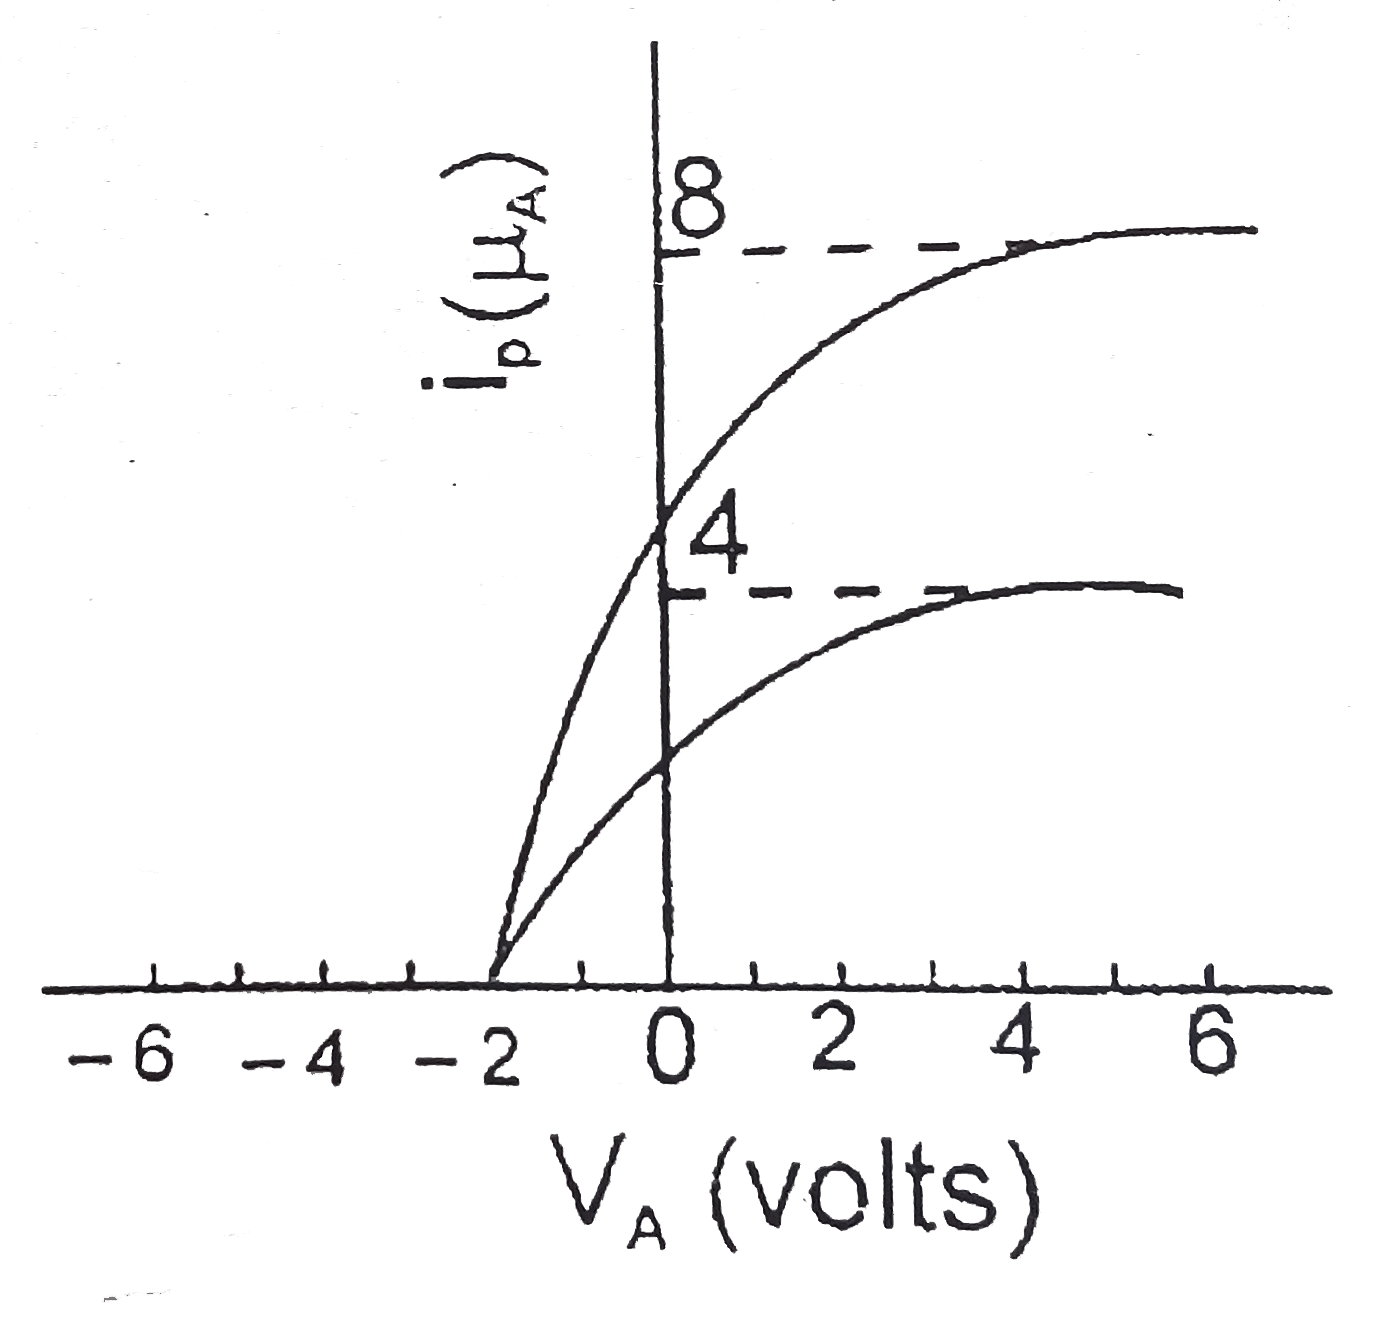
In a photoelectric experiment set up, photons of energy 5eV falls on the cathode having work function 3eV (a) if the saturation current is i=4μA for intensity 10−5W/m2, then plot a graph between anode potential and current (b) Also draw a graph for intensity of incident radiation 2×10⁻⁵W/m2
To solve the given problem step by step, we will analyze the photoelectric experiment setup and plot the required graphs.
Step 1: Understand the Given Information
- Photon energy (E_photon) = 5 eV
- Work function (Φ) = 3 eV
- Saturation current (I_saturation) = 4 µA for intensity (I_1) = 10−5W/m2
- We need to plot the graph between anode potential and current for two different intensities.
Step 2: Calculate the Stopping Potential
The stopping potential (V_s) can be calculated using the formula:
Vs=Ephoton−Φe
Where e is the charge of an electron (1 eV corresponds to 1 volt). Thus:
Vs=5eV−3eV=2V
Step 3: Plot the Graph for Intensity 10−5W/m2
1. The graph is plotted with the x-axis representing the anode potential (V) and the y-axis representing the current (I).
2. The stopping potential is 2 V, which indicates that the current will be zero for any potential less than 2 V.
3. At 2 V, the current reaches the saturation current of 4 µA.
4. For potentials greater than 2 V, the current remains constant at 4 µA.
Step 4: Plot the Graph for Intensity 2×10⁻⁵W/m2
1. Since the intensity is doubled, the saturation current will also double.
2. Thus, the new saturation current (I_saturation_new) = 2×4μA=8μA.
3. The stopping potential remains the same at 2 V.
4. The graph will have the same shape as the first graph, but the saturation current will be at 8 µA instead of 4 µA.
Step 5: Draw the Graphs
- For the first graph (intensity 10−5W/m2):
- From 0 V to 2 V, the current is 0.
- At 2 V, the current jumps to 4 µA and remains constant for higher potentials.
- For the second graph (intensity 2×10⁻⁵W/m2):
- From 0 V to 2 V, the current is 0.
- At 2 V, the current jumps to 8 µA and remains constant for higher potentials.
Final Graphs
- Both graphs will have the same x-axis (anode potential) and will start from the origin (0,0).
- The first graph will plateau at 4 µA, while the second graph will plateau at 8 µA.
- Photon energy (E_photon) = 5 eV
- Work function (Φ) = 3 eV
- Saturation current (I_saturation) = 4 µA for intensity (I_1) = 10−5W/m2
- We need to plot the graph between anode potential and current for two different intensities.
The stopping potential (V_s) can be calculated using the formula:
Vs=Ephoton−Φe
Where e is the charge of an electron (1 eV corresponds to 1 volt). Thus:
Vs=5eV−3eV=2V
1. The graph is plotted with the x-axis representing the anode potential (V) and the y-axis representing the current (I).
2. The stopping potential is 2 V, which indicates that the current will be zero for any potential less than 2 V.
3. At 2 V, the current reaches the saturation current of 4 µA.
4. For potentials greater than 2 V, the current remains constant at 4 µA.
1. Since the intensity is doubled, the saturation current will also double.
2. Thus, the new saturation current (I_saturation_new) = 2×4μA=8μA.
3. The stopping potential remains the same at 2 V.
4. The graph will have the same shape as the first graph, but the saturation current will be at 8 µA instead of 4 µA.
- For the first graph (intensity 10−5W/m2):
- From 0 V to 2 V, the current is 0.
- At 2 V, the current jumps to 4 µA and remains constant for higher potentials.
- From 0 V to 2 V, the current is 0.
- At 2 V, the current jumps to 8 µA and remains constant for higher potentials.
- Both graphs will have the same x-axis (anode potential) and will start from the origin (0,0).
- The first graph will plateau at 4 µA, while the second graph will plateau at 8 µA.
Topper's Solved these Questions
- BOOK - ALLENCHAPTER - SIMPLE HARMONIC MOTIONEXERCISE - Solved Example3videos
SIMPLE HARMONIC MOTION
- BOOK - ALLENCHAPTER - SIMPLE HARMONIC MOTIONEXERCISE - X Rays : Solved Example2videos
SIMPLE HARMONIC MOTION
- BOOK - ALLENCHAPTER - SIMPLE HARMONIC MOTIONEXERCISE - Paragraph3videos
SIMPLE HARMONIC MOTION
- BOOK - ALLENCHAPTER - RACEEXERCISE - Basic Maths (Wave Motion & Dopplers Effect) (Stationary waves & doppler effect, beats)24videos
RACE
- BOOK - ALLENCHAPTER - TEST PAPEREXERCISE - PHYSICS4videos
TEST PAPER
Similar Questions
In a photoelectric effect experiment, photons of energy 5eV are incident on the photocathode of work function 3eV. For photon intensity IA=1015m−2s−1, saturation current of 4.0μA is obtained. Sketch the variation of photocurrent ip against the anode voltage Va in the figure below for photon intensity IA ( curve A) and IB=2×10¹⁵m−2s−1 (curve B) ( in JEE graph was to be drawn in the answer sheet itself.)
 View Solution
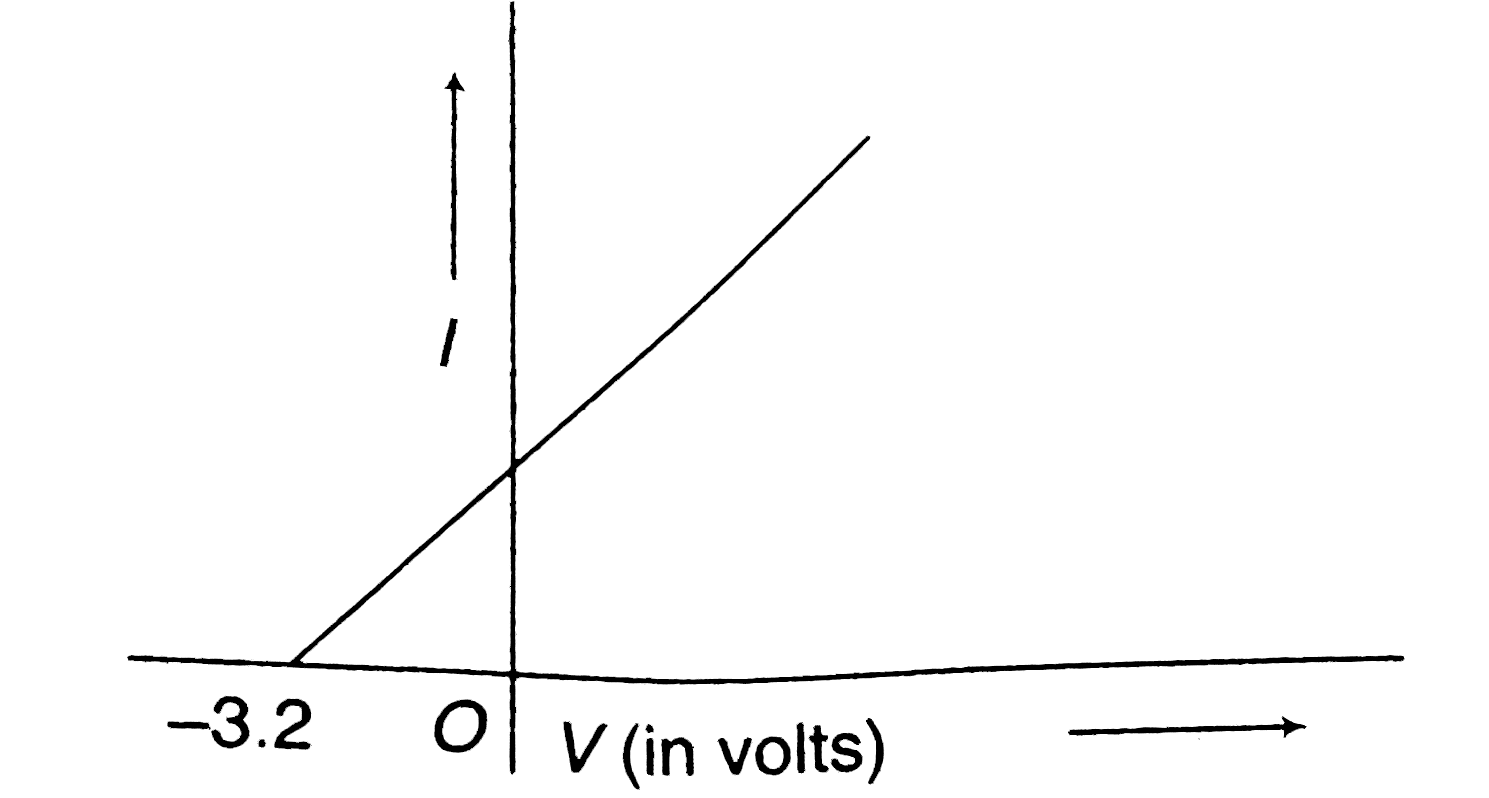
In a photoelectric experiment the relation between applied potential difference between cathode and anode V and the photoelectric current cathode and anode V and the photoelectric current l and was found to be shown in graph below. If planck's constant h=6.6×10⁻³⁴Js, the frequency of incident radiation would be nearly (in s−1)
 View Solution
Knowledge Check
- Question 1 - Select One
Radiations of intensity 0.5W/m2 are striking a metal plate. The pressure on the plate is
A0.166×10−8N m−2B0.332×10−8N m−2C0.111×10−8N m−2D0.083×10−8N m−2
Monochromatic photons of energy 3.3 eV are incident on a photo sensitive surface of work function 2.4 eV. Calculate the threshold frequency of incident radiation.
View SolutionAt t=O, light of intensity 1012 photons/s−m2 of energy 6eV per photon starts falling on a plate with work founction 2.5eV If area of the plate is 2×10⁻⁴m2 and for every 105 photons one photoelectron is emitted, charge on the plate at t=25 s is
View SolutionRadiations of intensity 0.5W/m2 are striking a metal plate. The pressure on the plate is
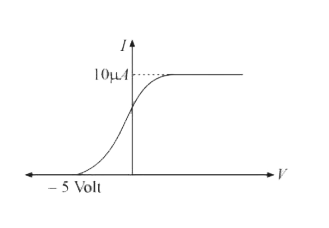
View SolutionIn the photoelectric experiment, if we use a monochromatic light, theI–V curve is as shown. If work function of the metal is 2 eV, estimate the power of light used. (Assume efficiency of photo emission =10−3, i.e. number of photoelectrons emitted are 10−3 times of number of photons incident on metal).
 View Solution
In the photoelectric experiment, if we use a monochromatic light, theI–V curve is as shown. If work function of the metal is 2 eV, estimate the power of light used. (Assume efficiency of photo emission =10−3, i.e. number of photoelectrons emitted are 10−3 times of number of photons incident on metal).
 View Solution
Sodium and copper have work functions 2.3eVand4.5eV respectively . Then the ratio of the wavelength is nearest
View SolutionSodium and copper have work functions 2.3eVand4.5eV respectively . Then the ratio of the wavelength is nearest
View Solution

