Which of the following graphs shows the relationship between the rate of an enzymatic activity and substrate concentration (S) ?
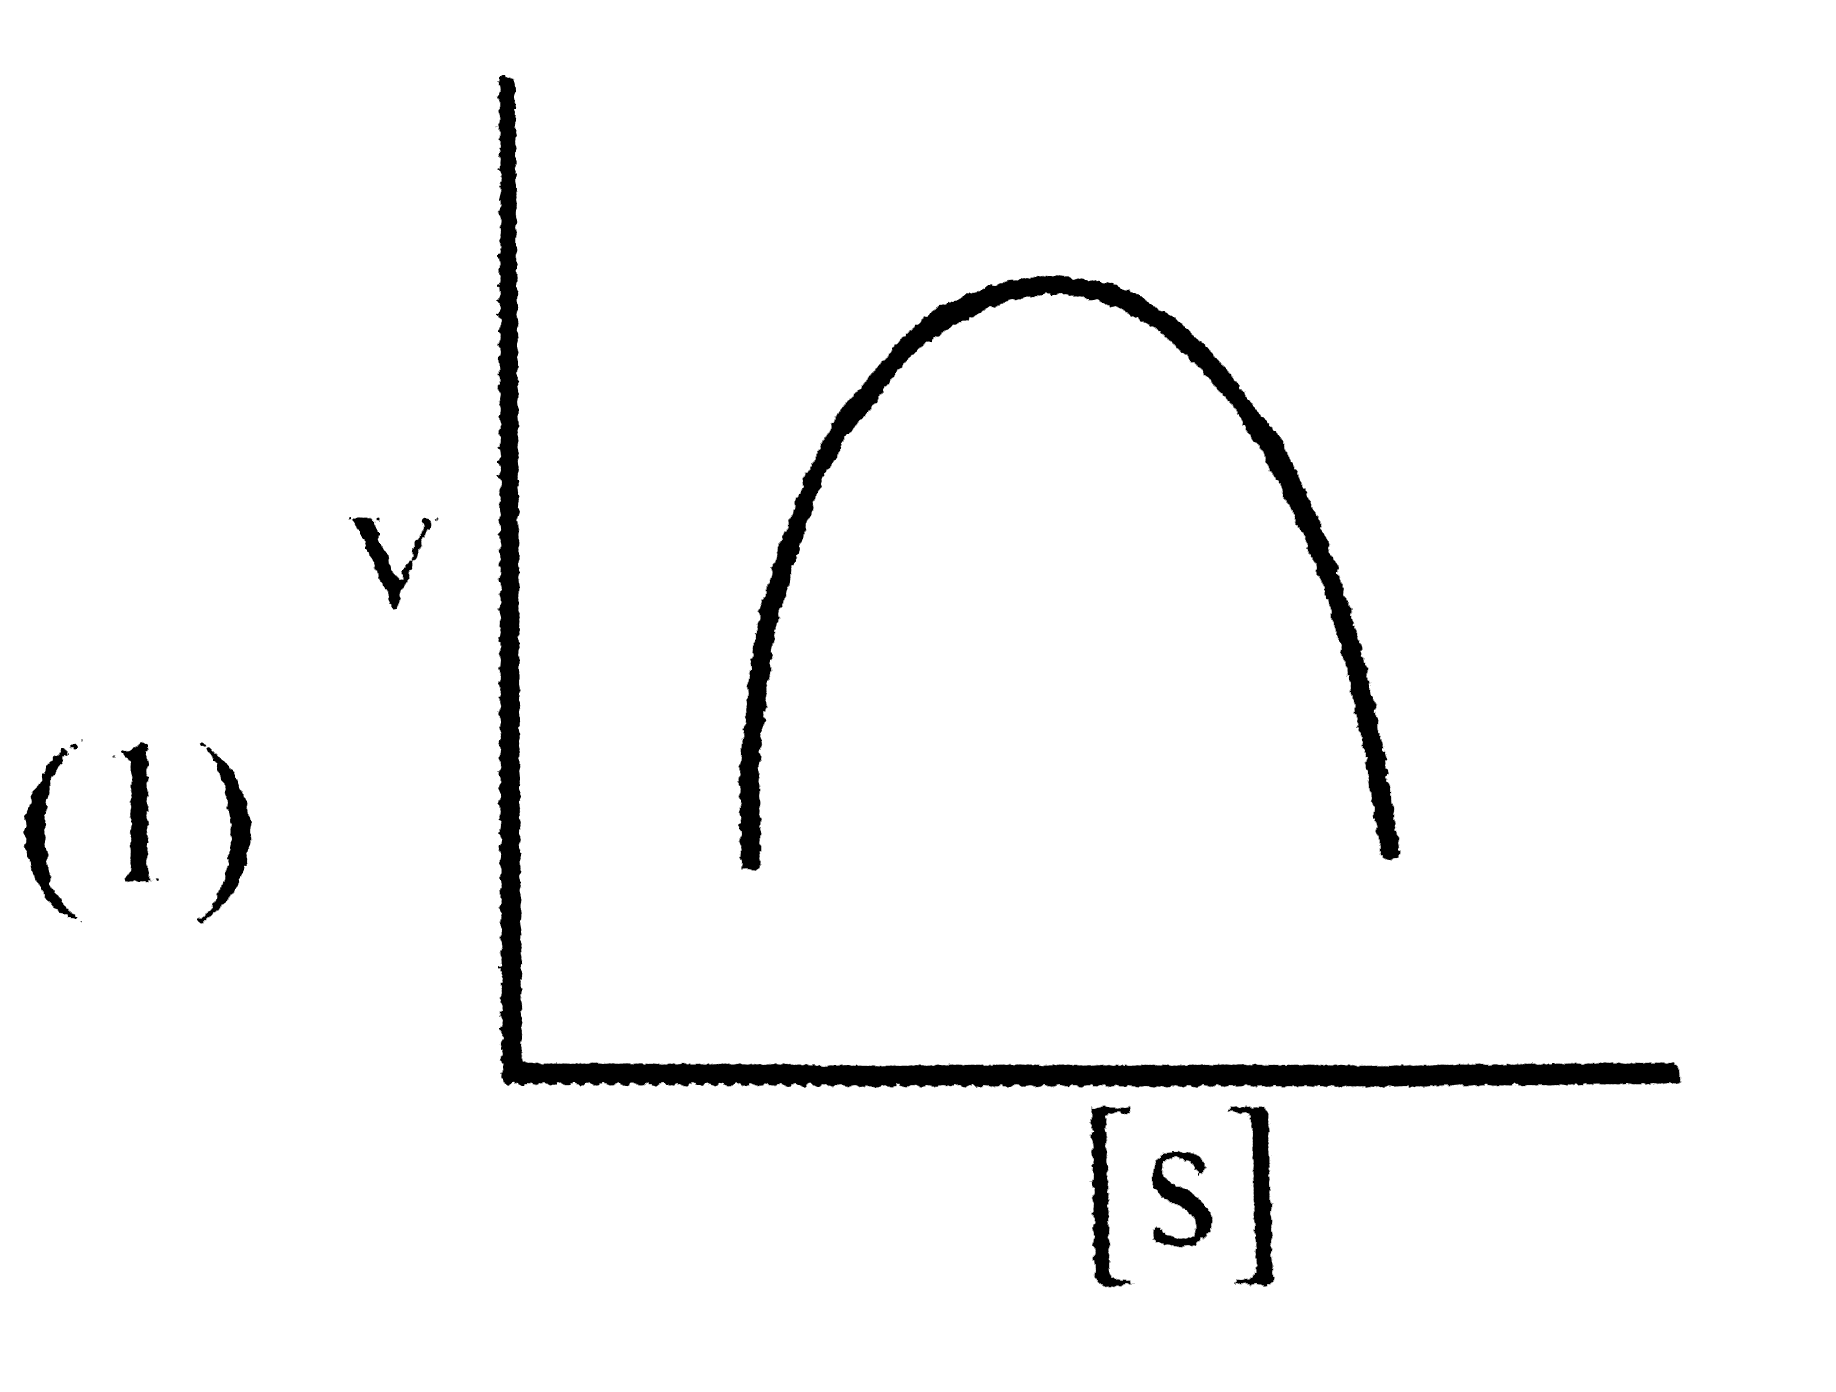
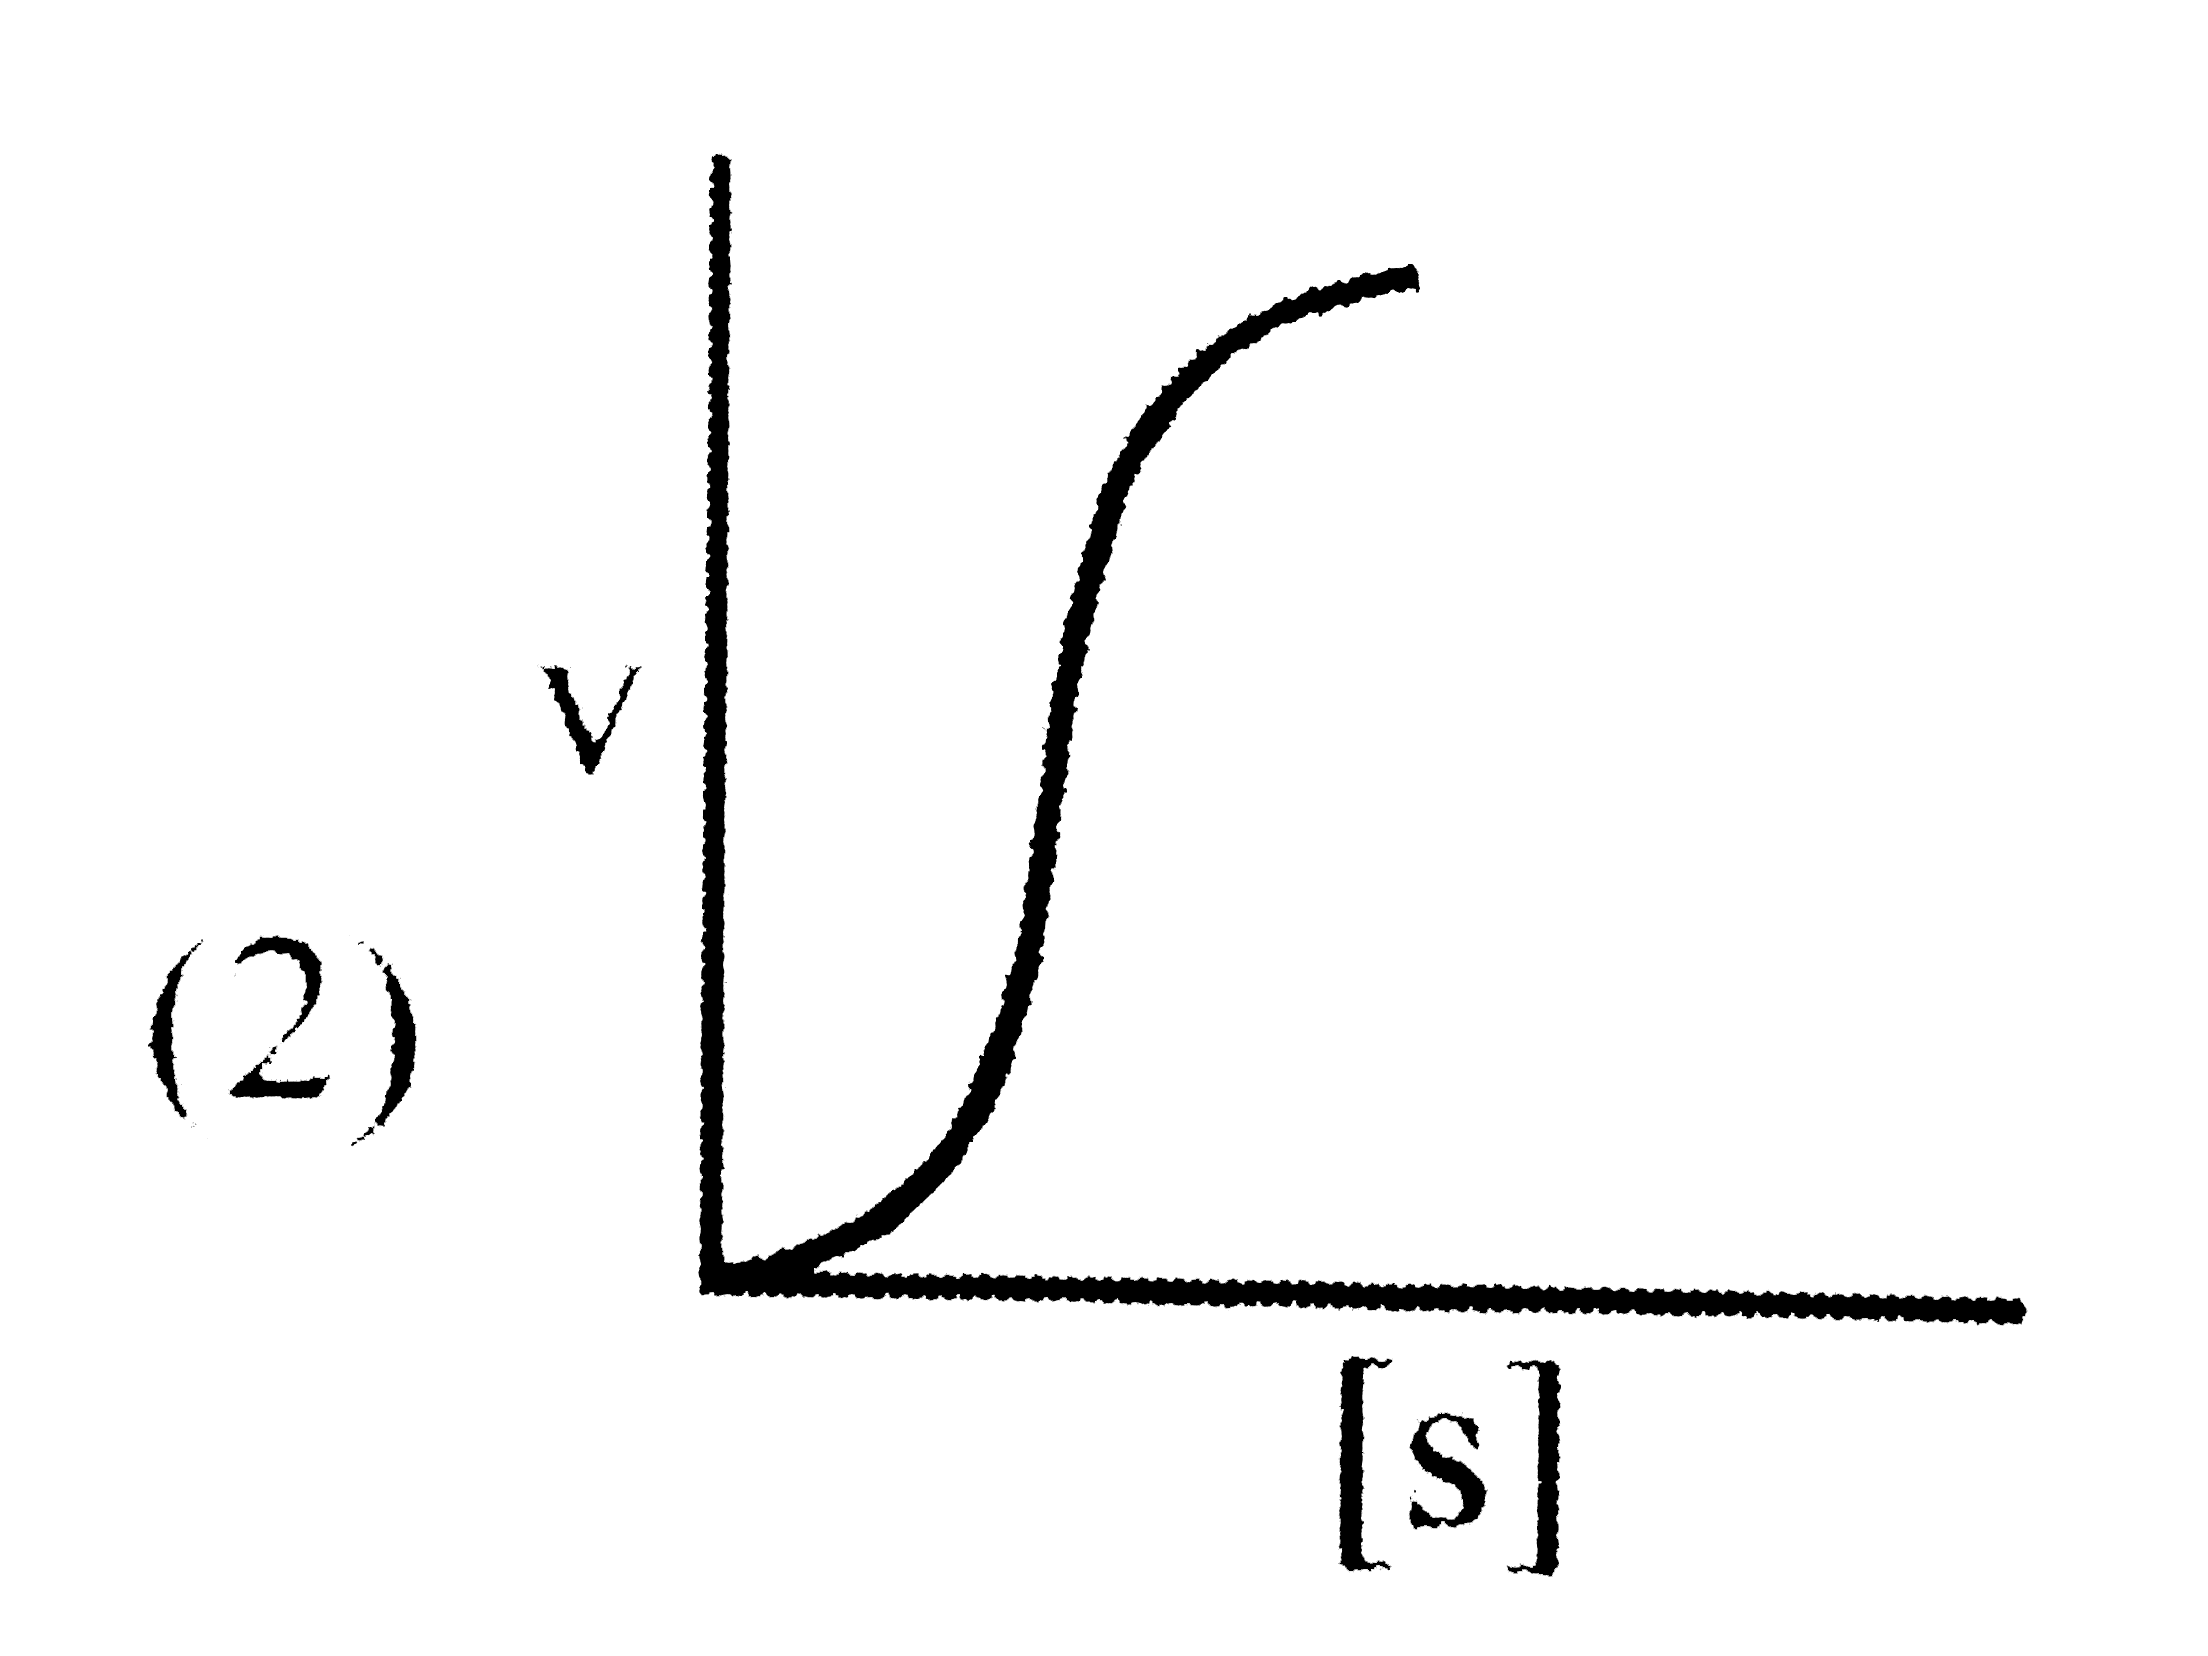
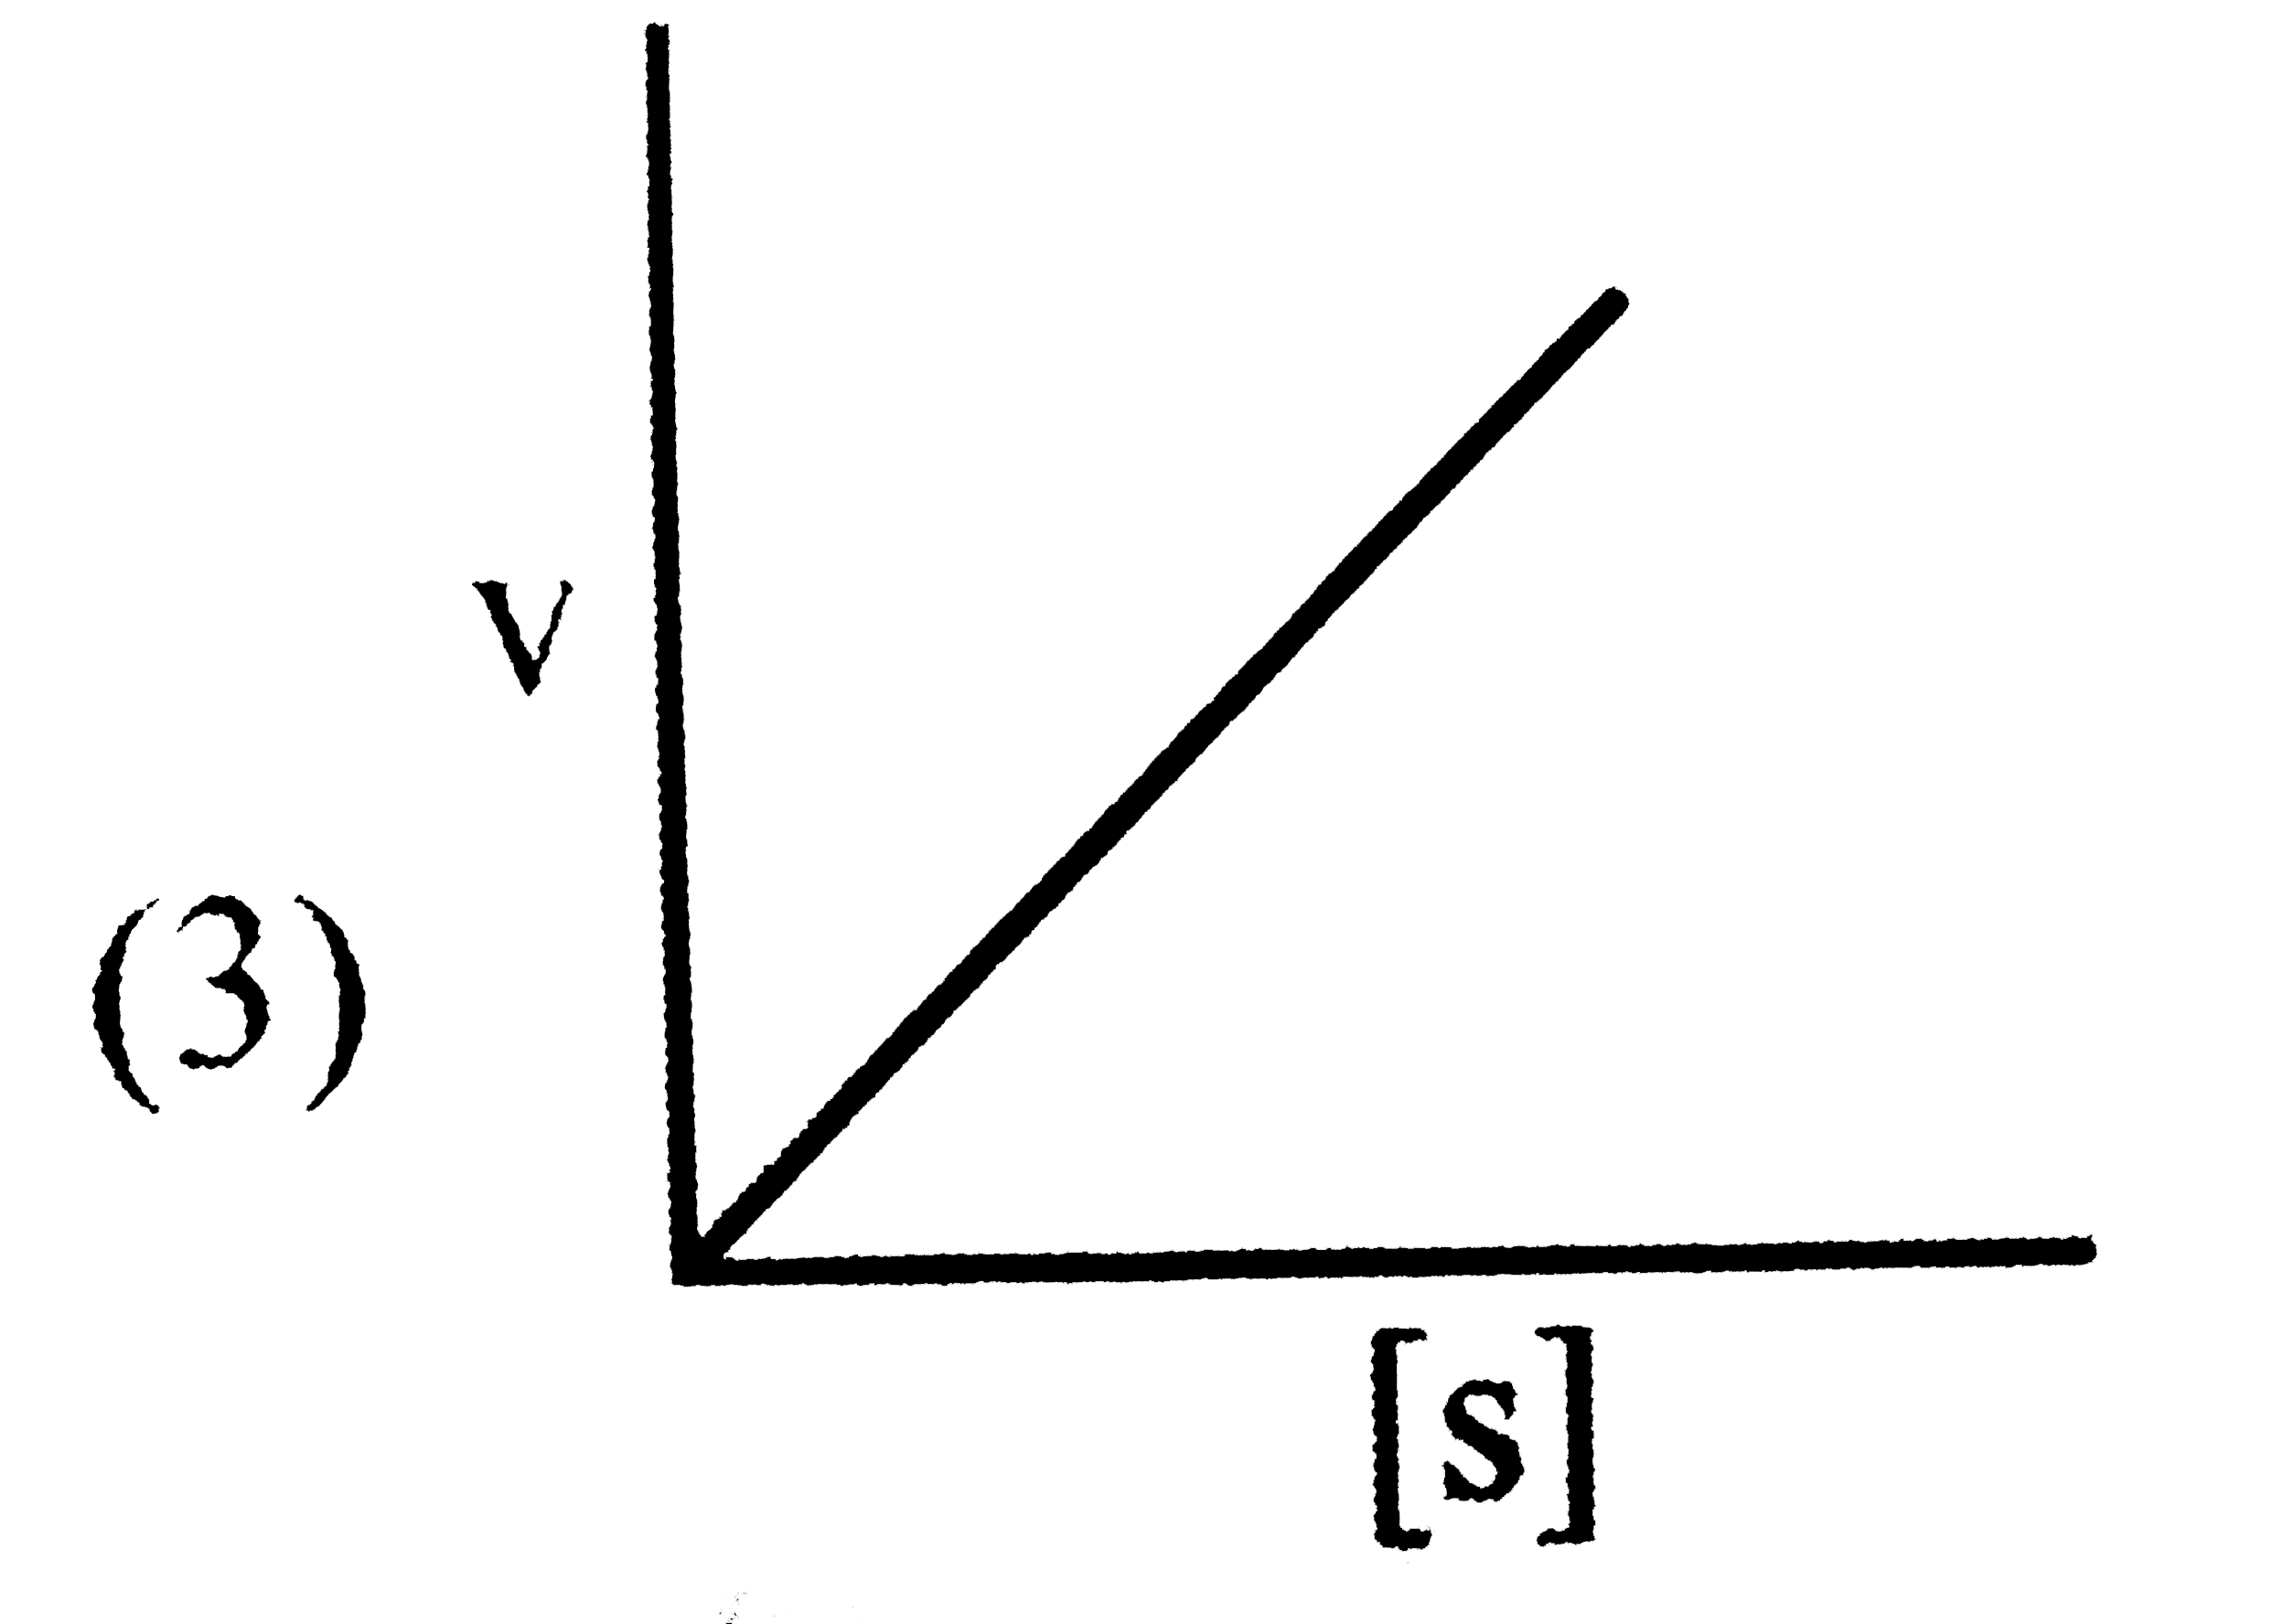
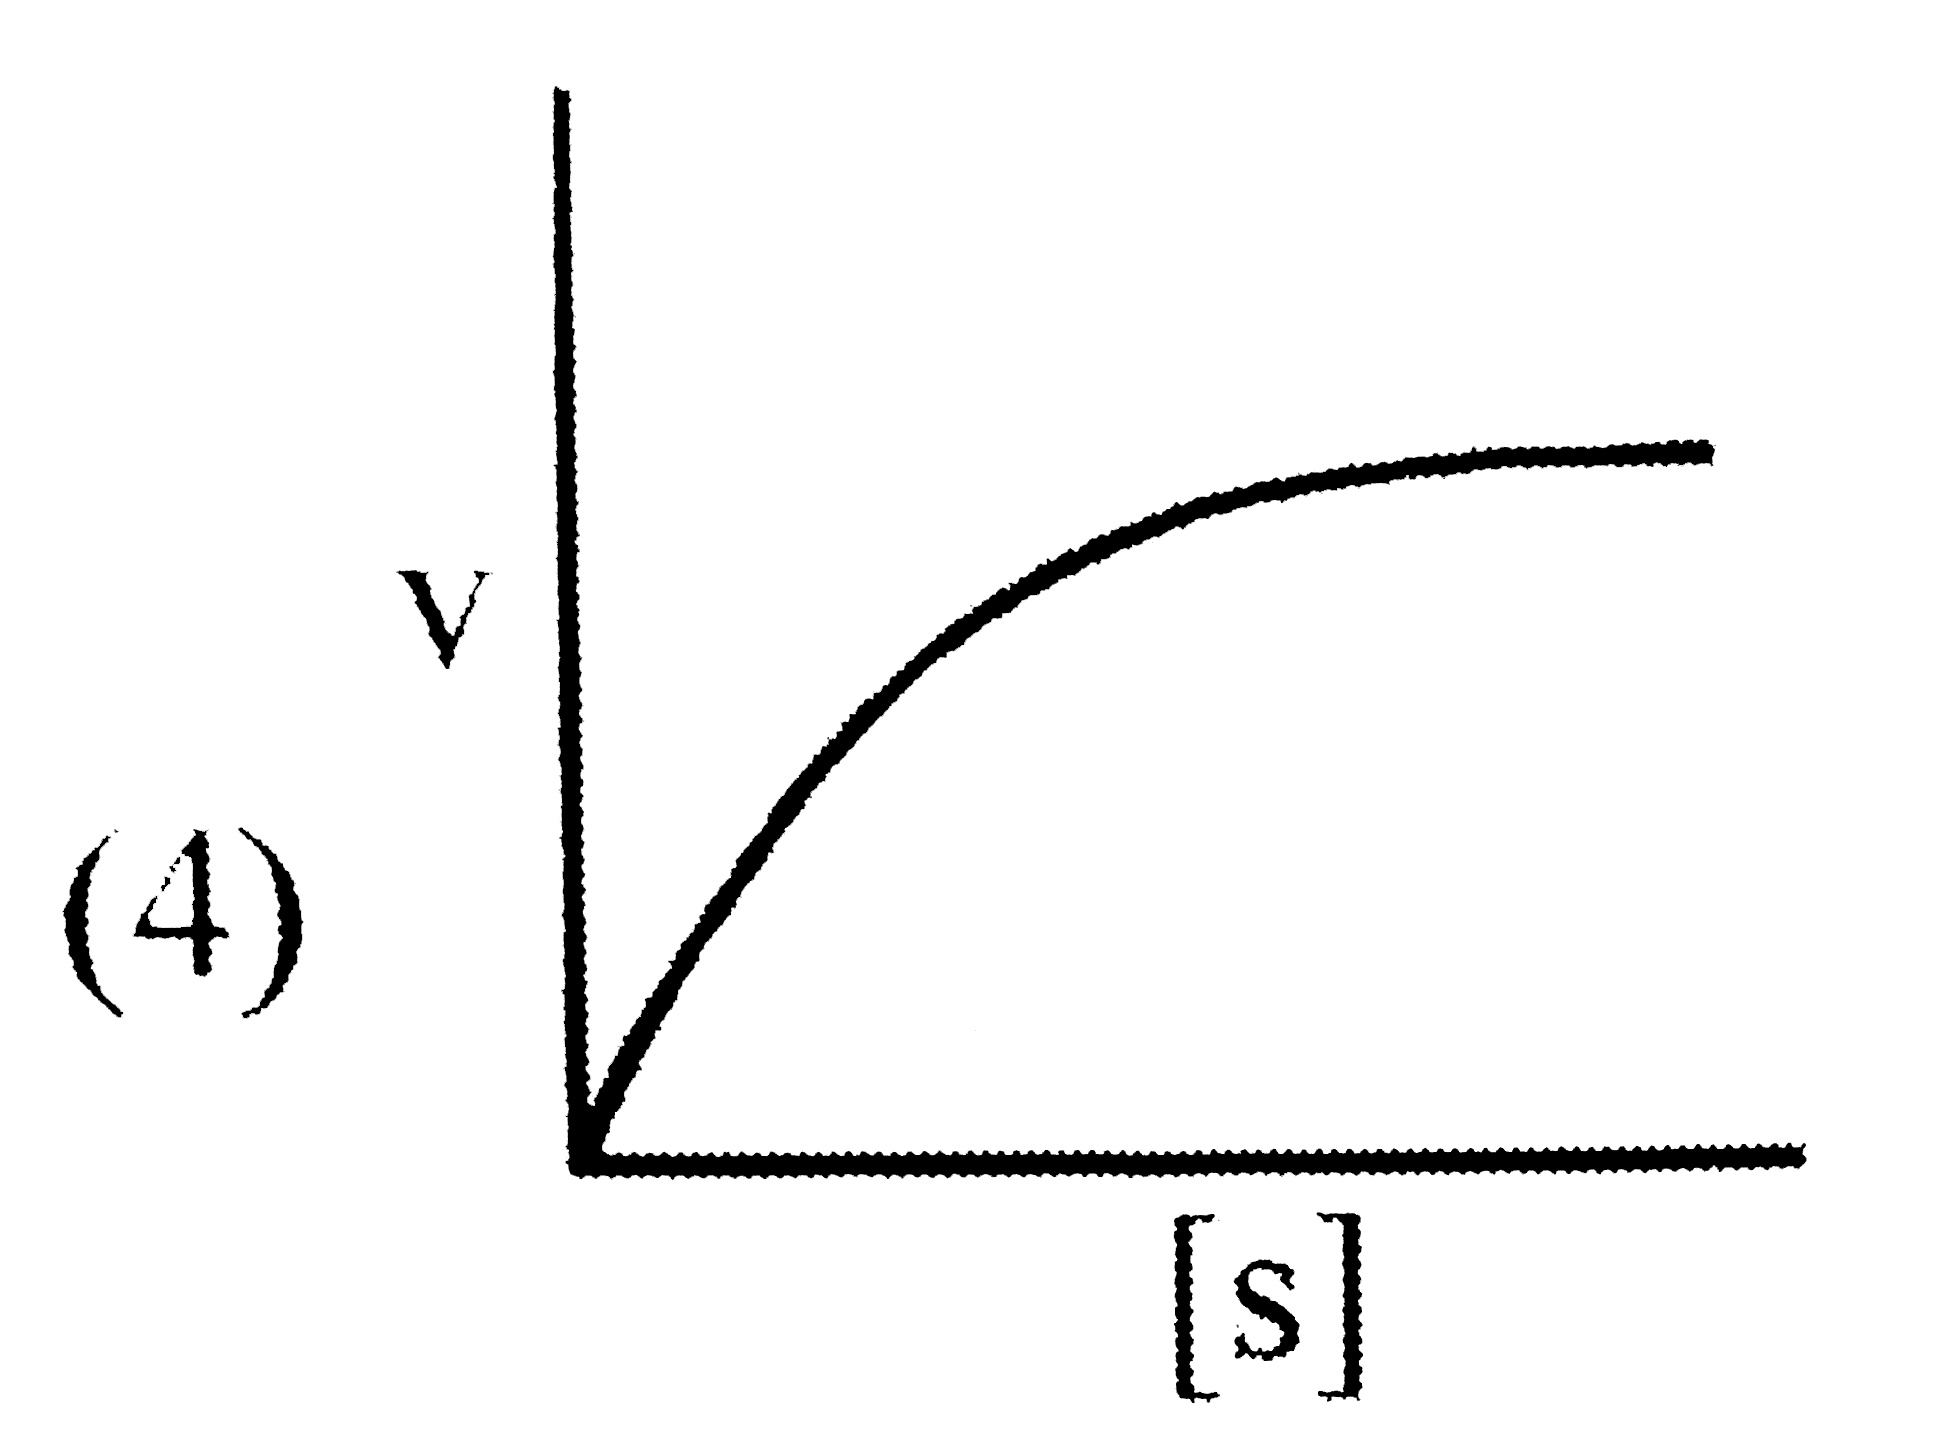
The correct Answer is:D
Step by step video & image solution for Which of the following graphs shows the relationship between the rate of an enzymatic activity and substrate concentration (S) ? by Biology experts to help you in doubts & scoring excellent marks in Class 12 exams.
Updated on:21/07/2023Topper's Solved these Questions
- BIOLOGY AT A GLANCEBook:ALLENChapter:BIOLOGY AT A GLANCEExercise:Reproduction In Plants
Explore 25 Videos
- BIOLOGY AT A GLANCEBook:ALLENChapter:BIOLOGY AT A GLANCEExercise:Genetics
Explore 29 Videos
- BIOLOGY AT A GLANCEBook:ALLENChapter:BIOLOGY AT A GLANCEExercise:Cell Biology
Explore 80 Videos
- BIODIVERSITY AND CONSERVATIONBook:ALLENChapter:BIODIVERSITY AND CONSERVATIONExercise:S
Explore 18 Videos
- BIOLOGY AT A GLANCE (ZOOLOGY )Book:ALLENChapter:BIOLOGY AT A GLANCE (ZOOLOGY )Exercise:EXERCISE
Explore 207 Videos
Similar Questions
Knowledge Check
Which of the following graphs shows a stong positive association between x and y?
A B
B C
C D
D
Which of the following formulae does not show the correct relationship ?
AB.O.=12(Nb−Na)BB.O.∝1Bond lengthCB.O.∝1Bond dissociation energyDNb>Na,B.O.=+ve
Which of the following shows optical activity?
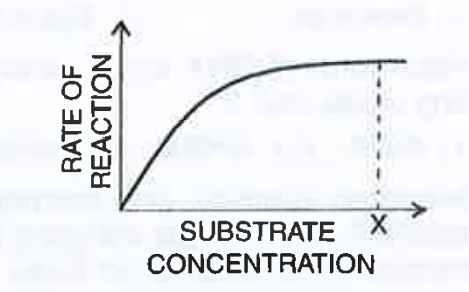
View SolutionThe given graph is showing the relationship between the rate of enzyme reaction and concentration of substrate. At concentration of substrate greater than X, the
View SolutionWhich of the following pair does not show correct relationship ?
View SolutionWhich of the following does not show the relationship between Boyle's law and Charles' law?
View SolutionLichens show symbiotic relationships between
View SolutionWhich of the following will show optical activity
View Solution