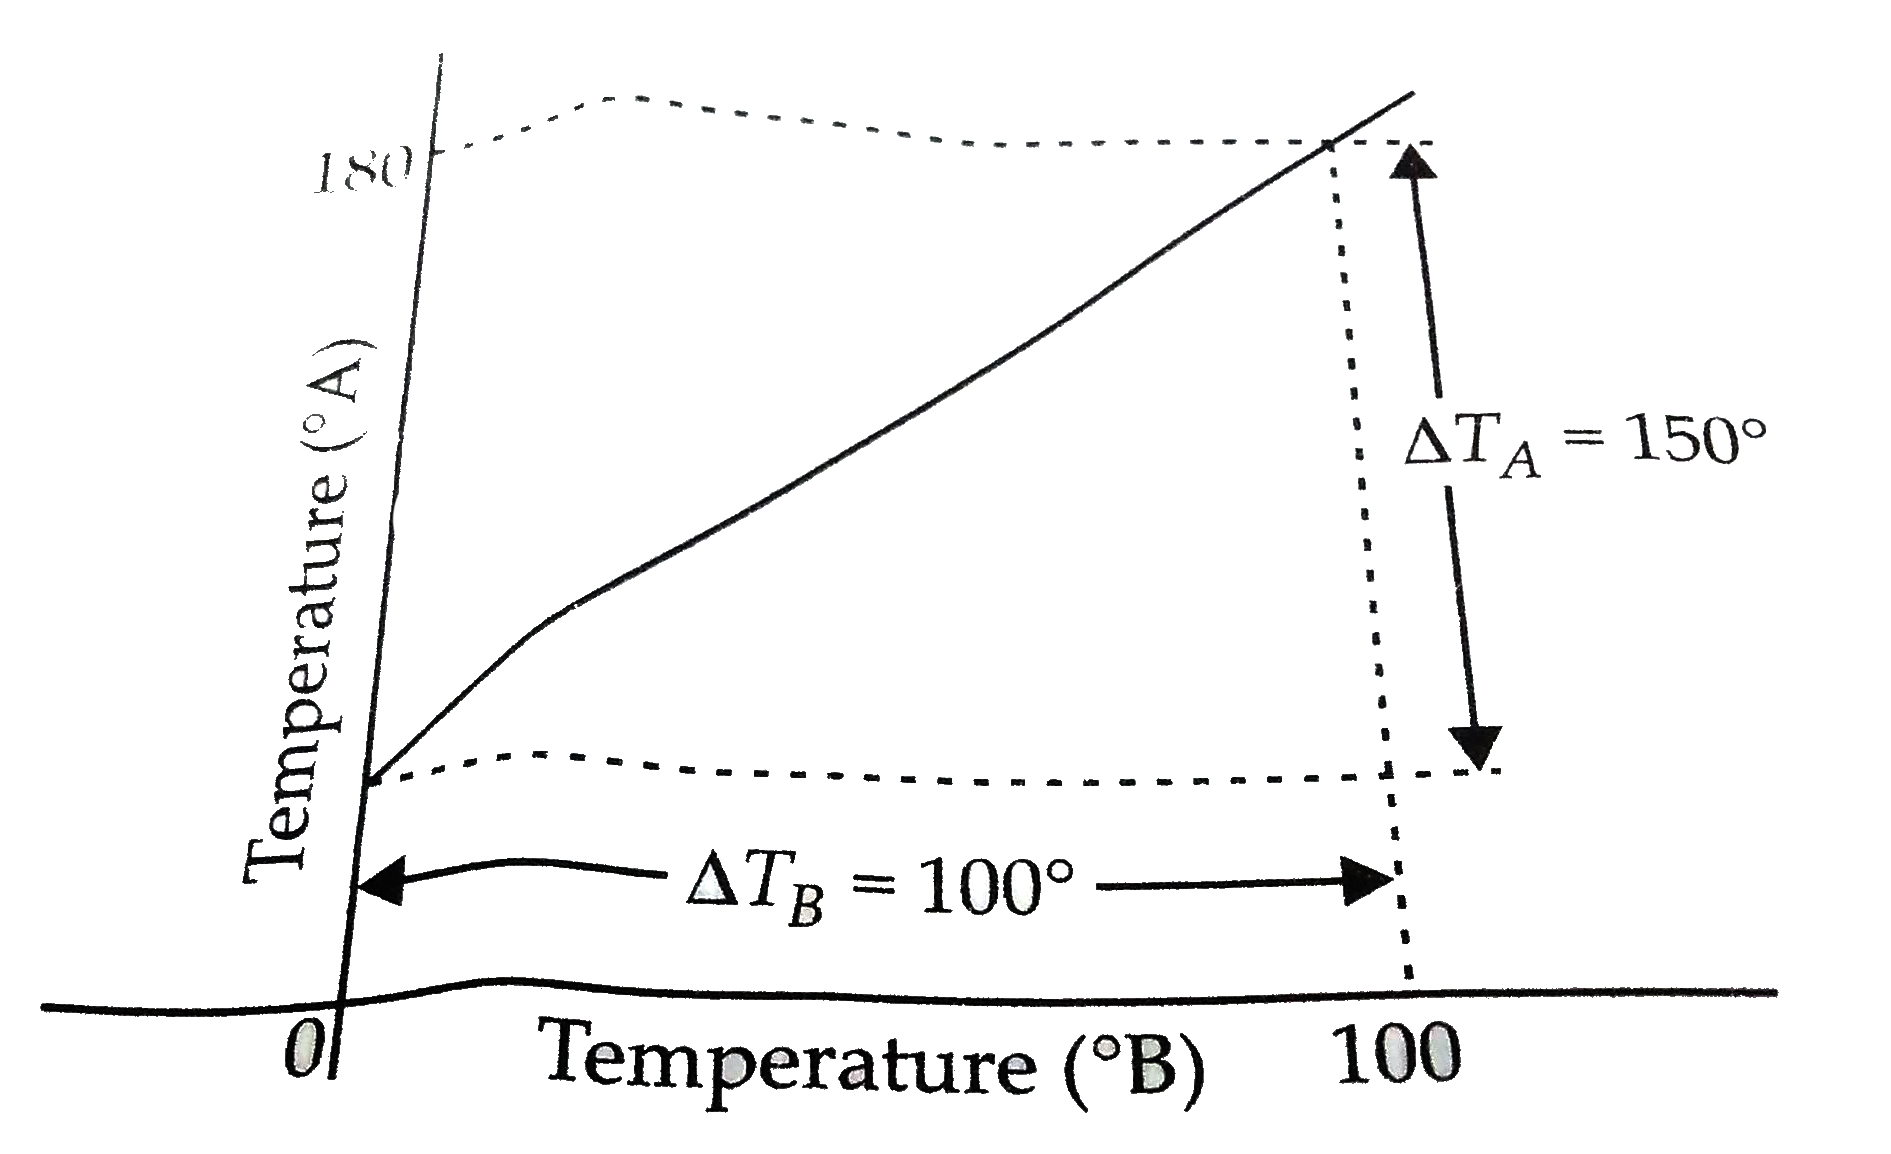
The graph between two temperature scales A and B is shown in figure. Between upper fixed point and lower fixed point there are 150 equal division on scale A and 100 on scale B. The relationship for conversion between the two scales is given by
tA−180100=tB150
tA−30150=tB100
tA−180150=tA100
tB−40100=tA180
The correct Answer is:B
Step by step video & image solution for The graph between two temperature scales A and B is shown in figure. Between upper fixed point and lower fixed point there are 150 equal division on scale A and 100 on scale B. The relationship for conversion between the two scales is given by by Physics experts to help you in doubts & scoring excellent marks in Class 12 exams.
Updated on:21/07/2023Topper's Solved these Questions
- RACEBOOK - ALLENCHAPTER - RACEEXERCISE - Basic Maths (Thermal Physics) (Calorimetry)
14 Videos
- RACEBOOK - ALLENCHAPTER - RACEEXERCISE - Basic Maths (Thermal Physics) (Mode of Heat Transfer)
14 Videos
- RACEBOOK - ALLENCHAPTER - RACEEXERCISE - Basic Maths (Properties of Matter & Fluid Mechanics)(Surface Tension)
26 Videos
- NEWTONS LAWS OF MOTIONBOOK - ALLENCHAPTER - NEWTONS LAWS OF MOTIONEXERCISE - EXERCISE-III
28 Videos
- SIMPLE HARMONIC MOTIONBOOK - ALLENCHAPTER - SIMPLE HARMONIC MOTIONEXERCISE - Example
1 Videos
Similar Questions
The graph between two temperature scales A and B is shown in Fig. Between upper fixed point and lower fixed point there are 150 equal divisions on scales A and 100 on scale B. The relation between the temperature in two scales is given by_
_S01_001_Q01.png)
View SolutionThe voltage drop between the points A and B in the given figure is

View Solution
Knowledge Check
The graph between two temperature scales A and B is shown in Fig. Between upper fixed point and lower fixed point there are 150 equal divisions on scales A and 100 on scale B. The relation between the temperature in two scales is given by_
_S01_001_Q01.png) ATA−180100=TB150BTA−30150=TB100CTB−180150=TA100DTB−40100=TA180
ATA−180100=TB150BTA−30150=TB100CTB−180150=TA100DTB−40100=TA180
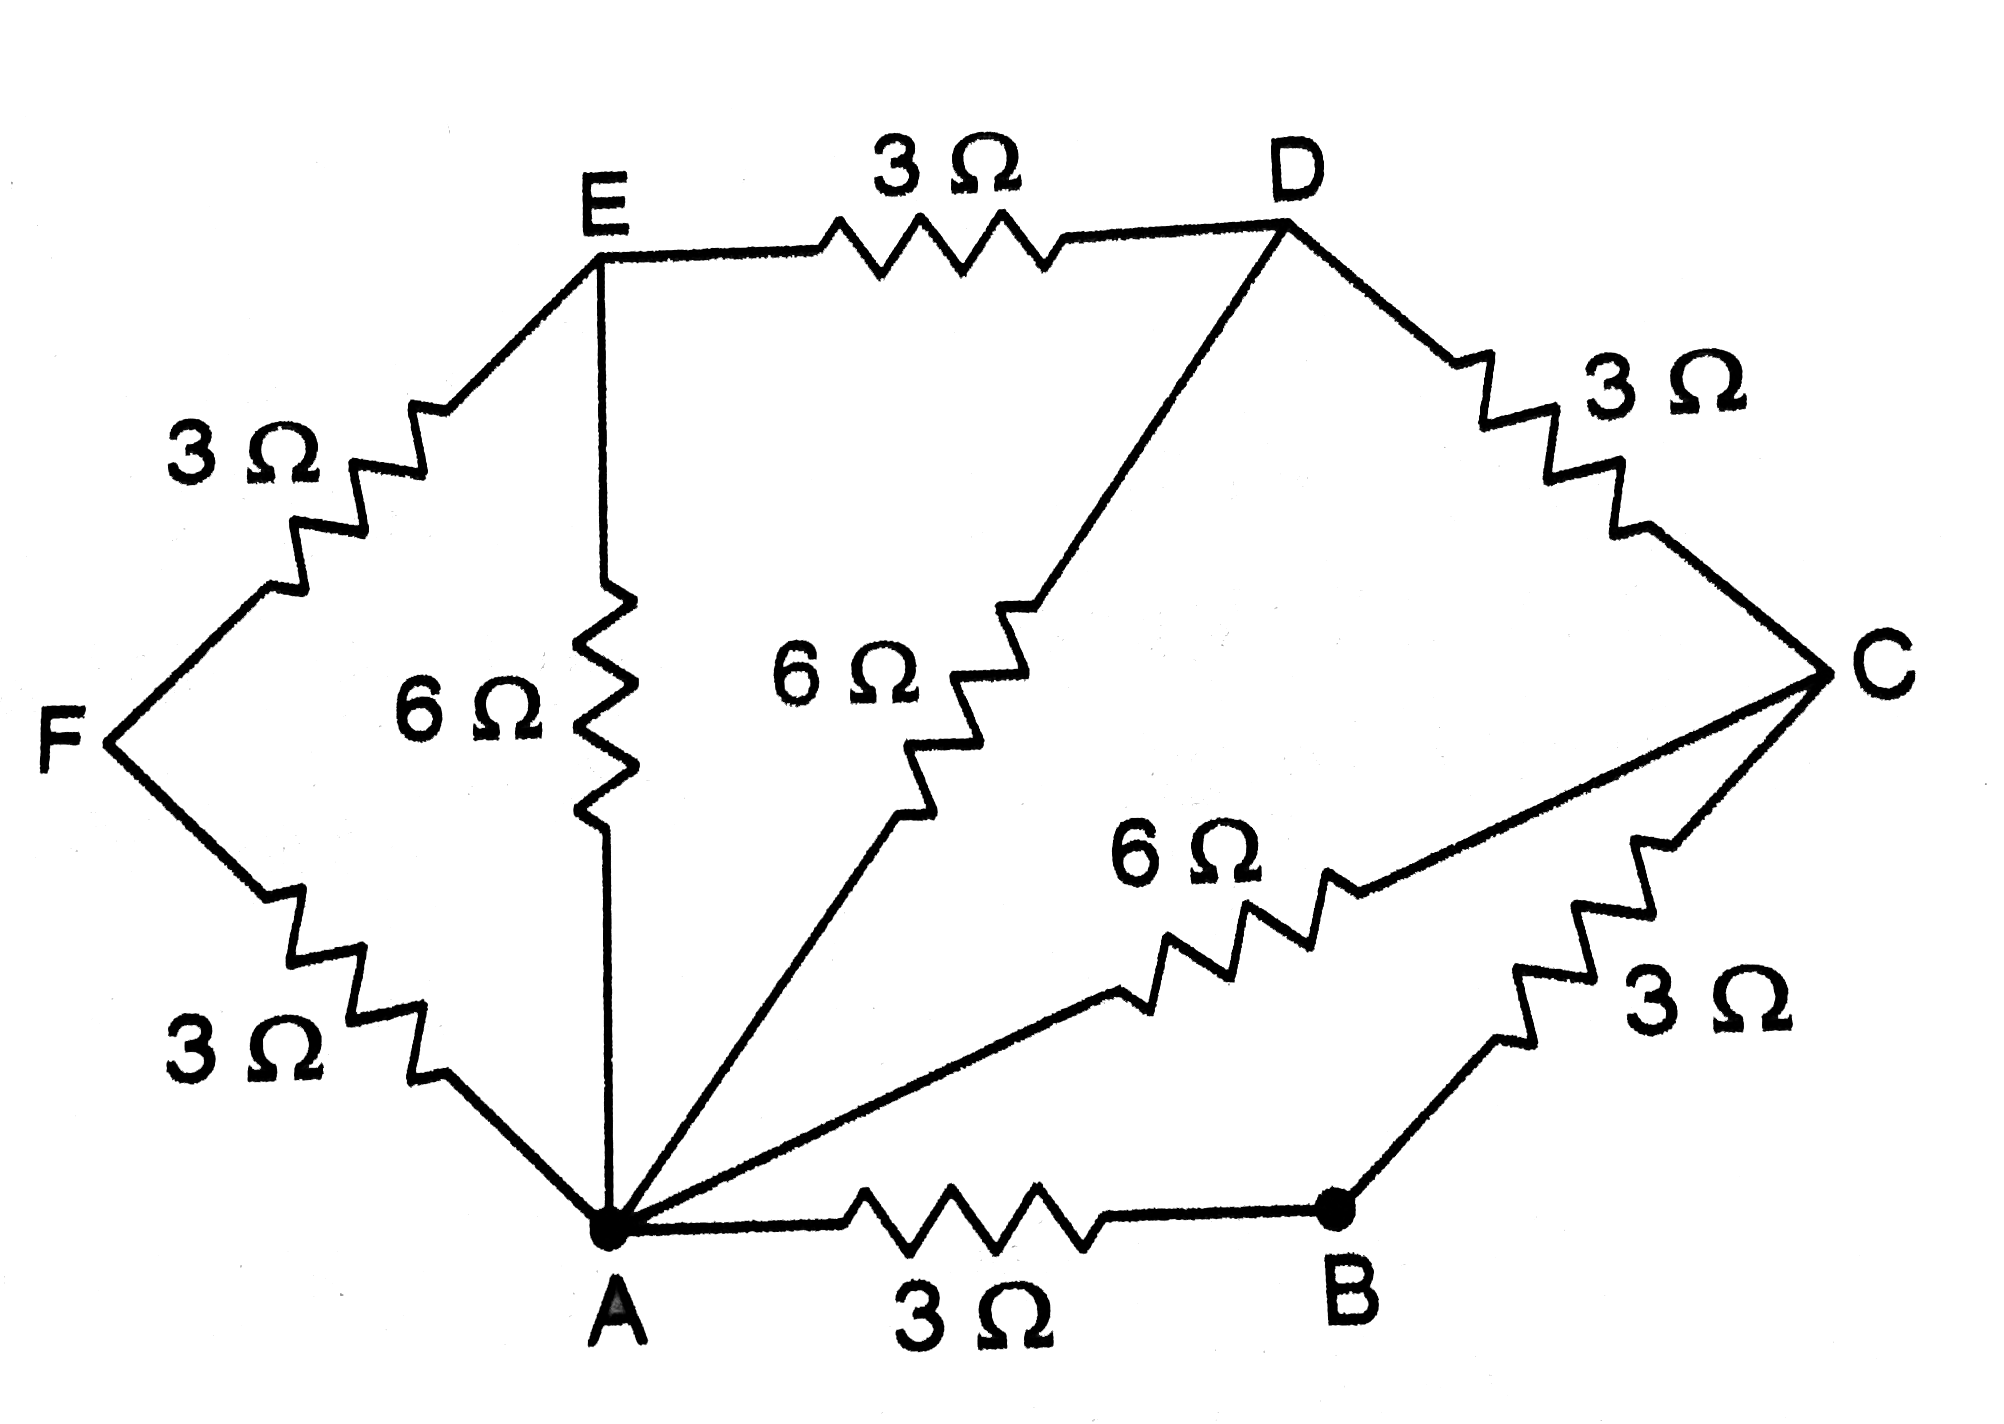
Find the equivalent resistance of the network shown in figure between the points A and B .
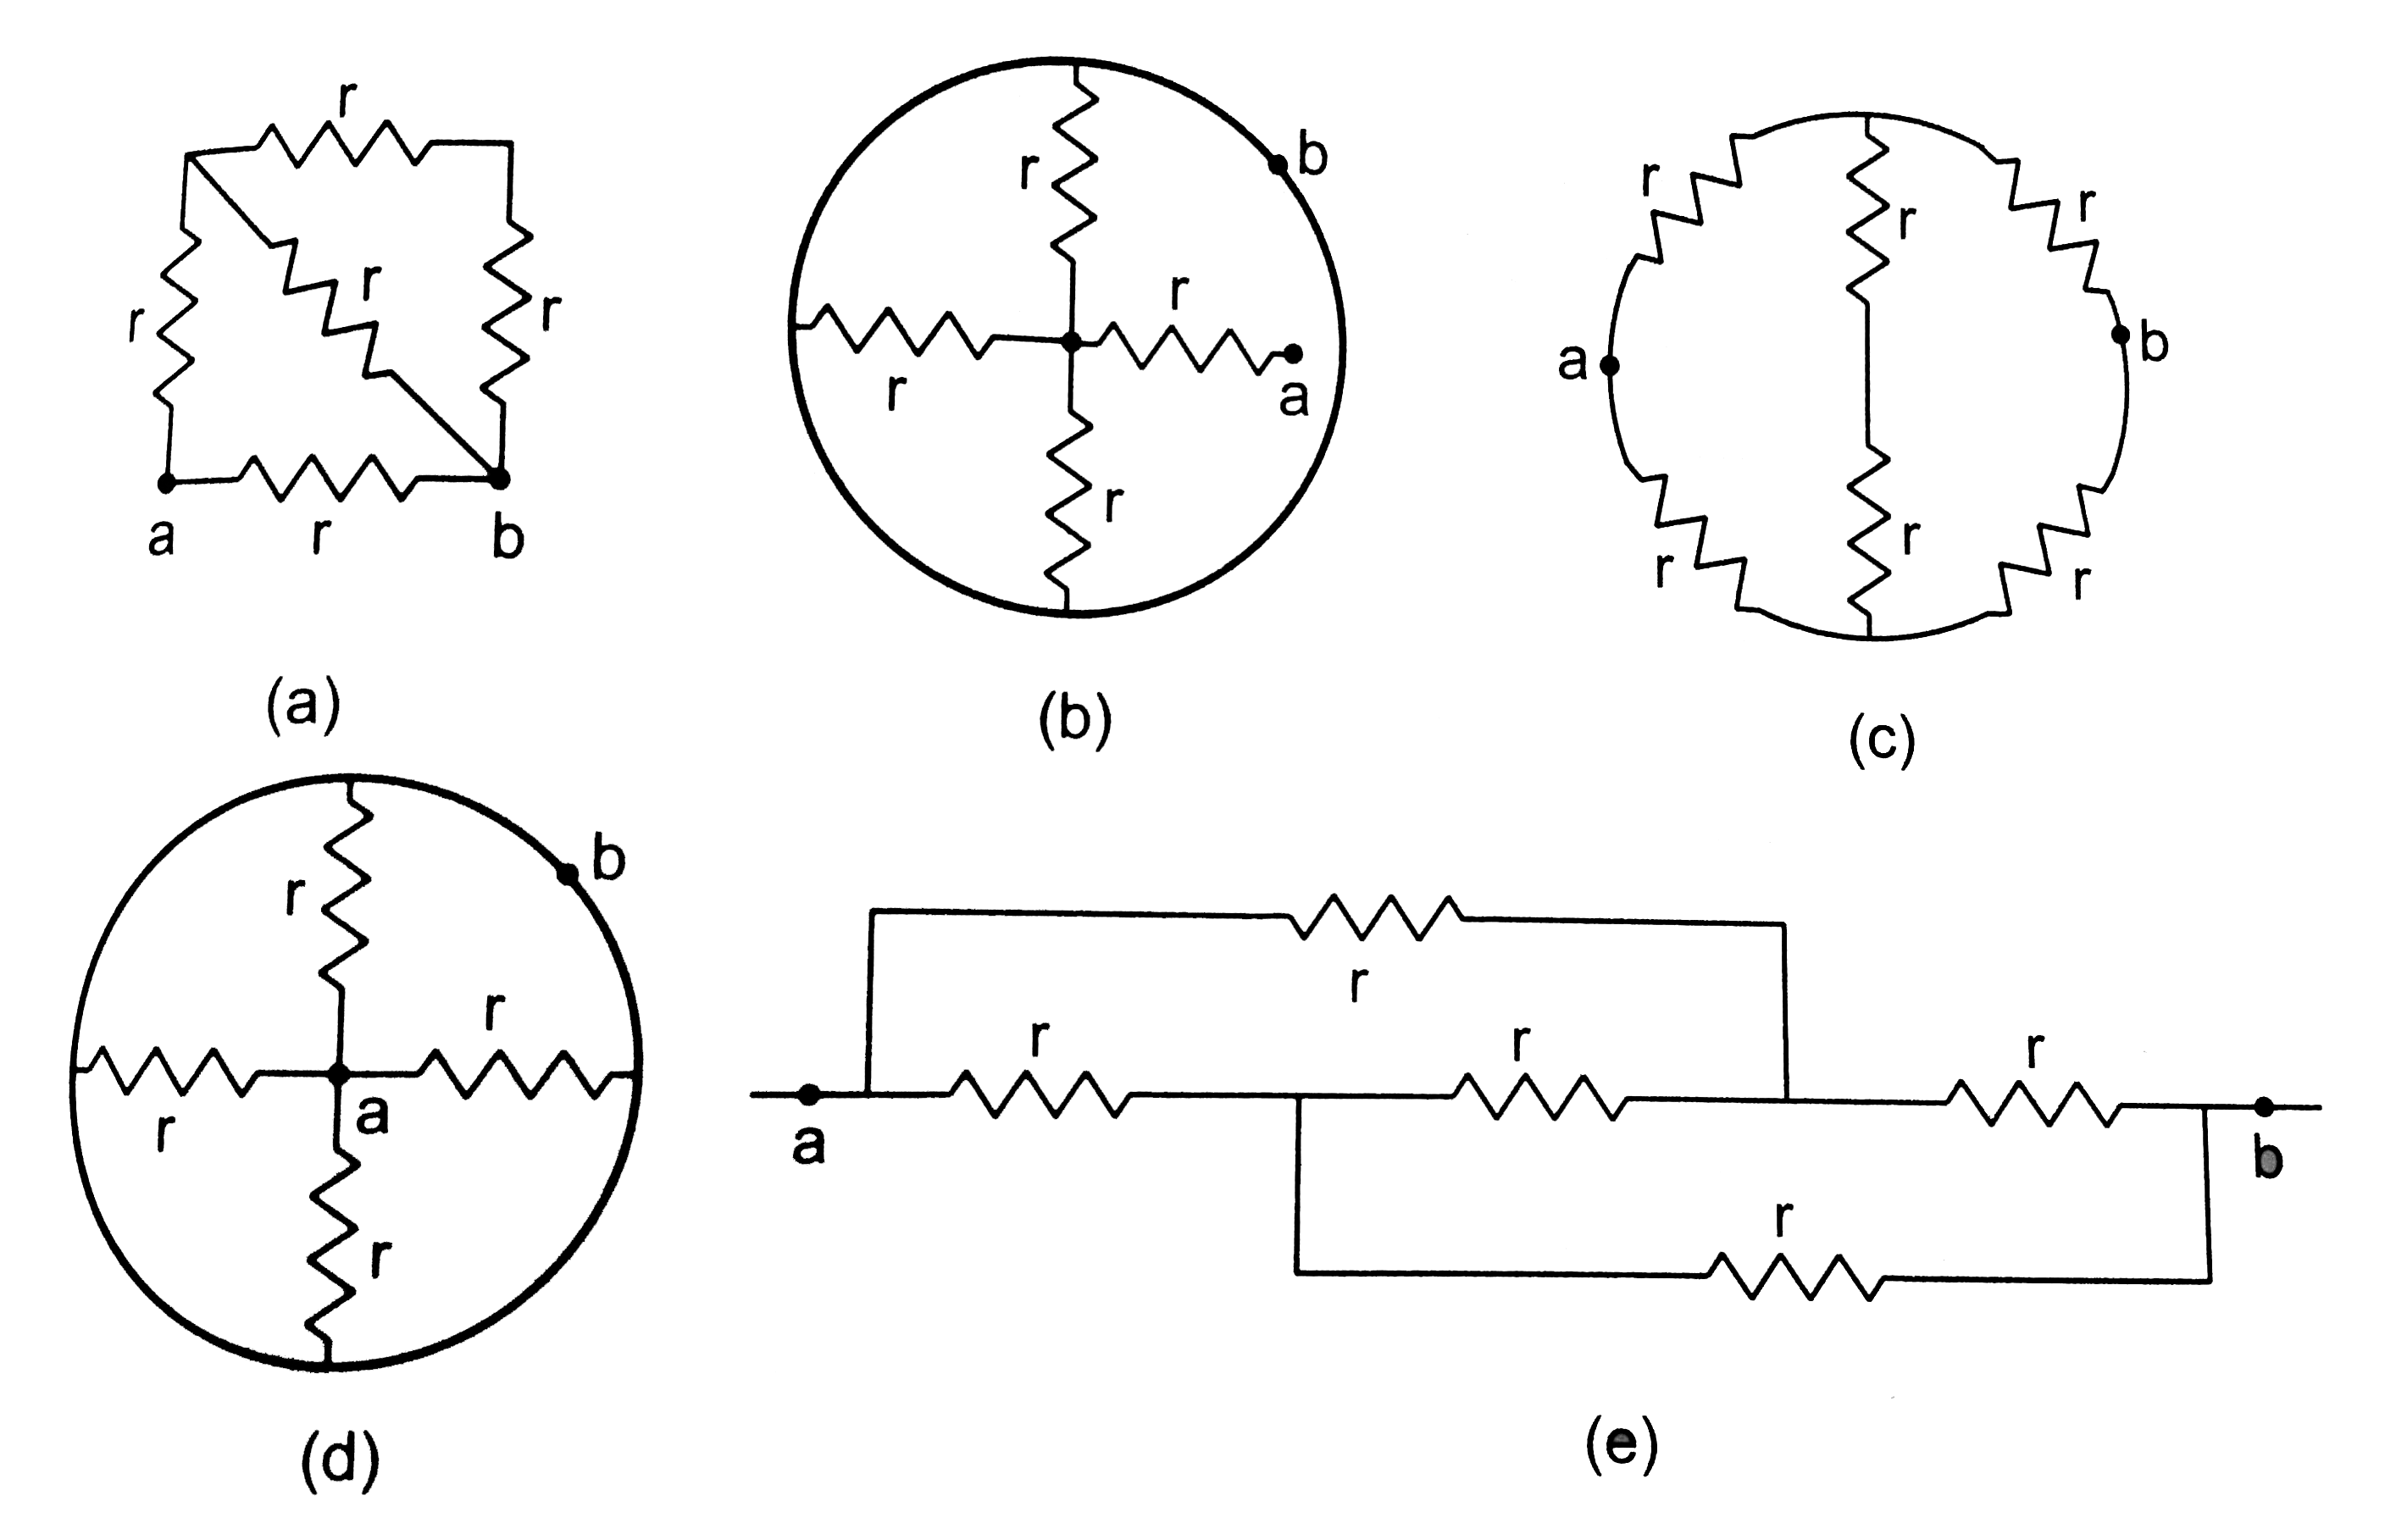
View SolutionFind the equivalent resistances of the network shown in figure between the point a and b.
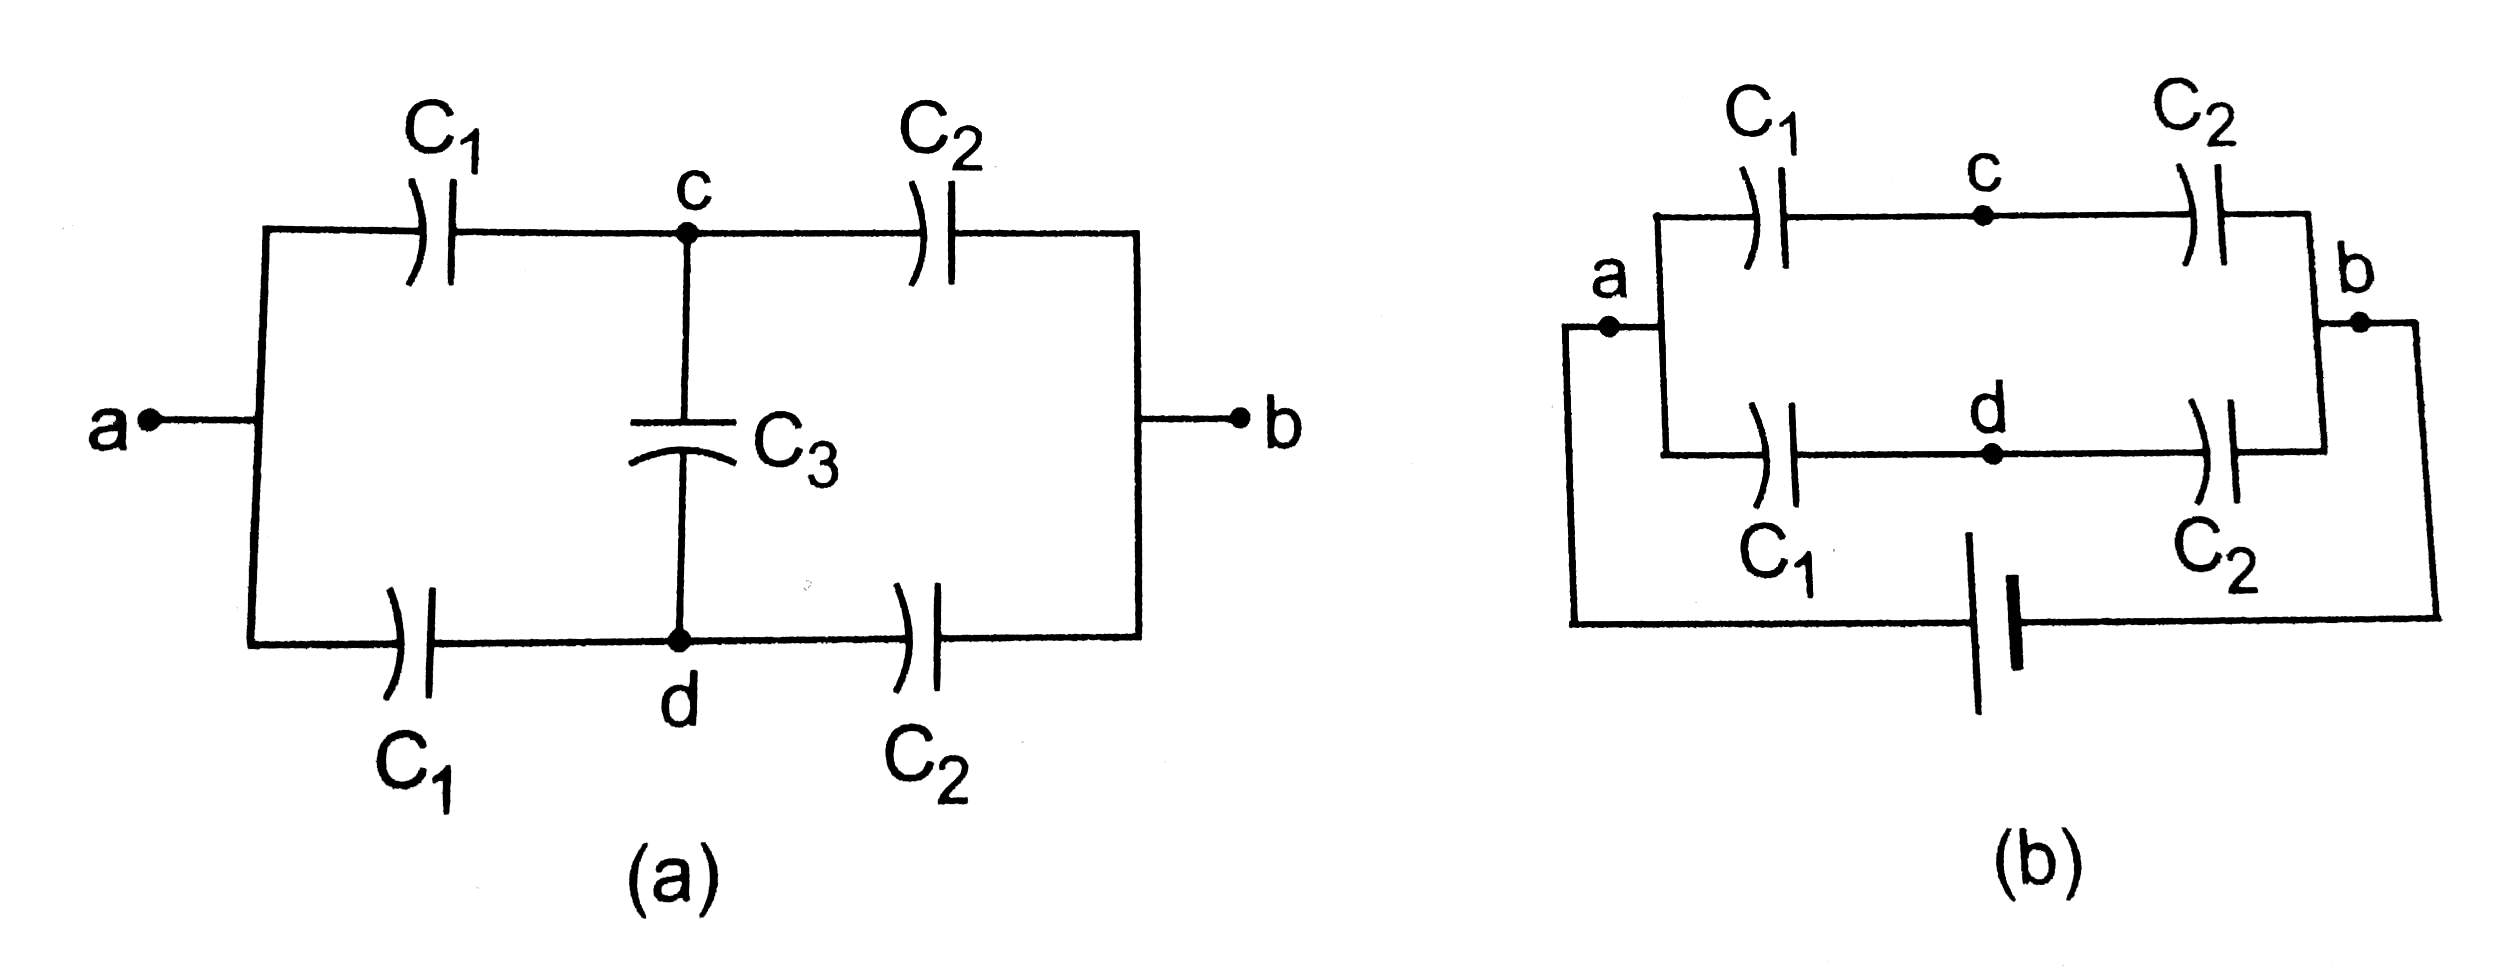
View SolutionFind the equivalent capacitance of the system shown in figure between the points a and b.
View SolutionWrite down the temperature of lower fixed point, on the Fahrenheit scale.
View SolutionWhat is the relationship between the Celsius and the Kelvin scales of temperature ?
View SolutionConsider the following figure,
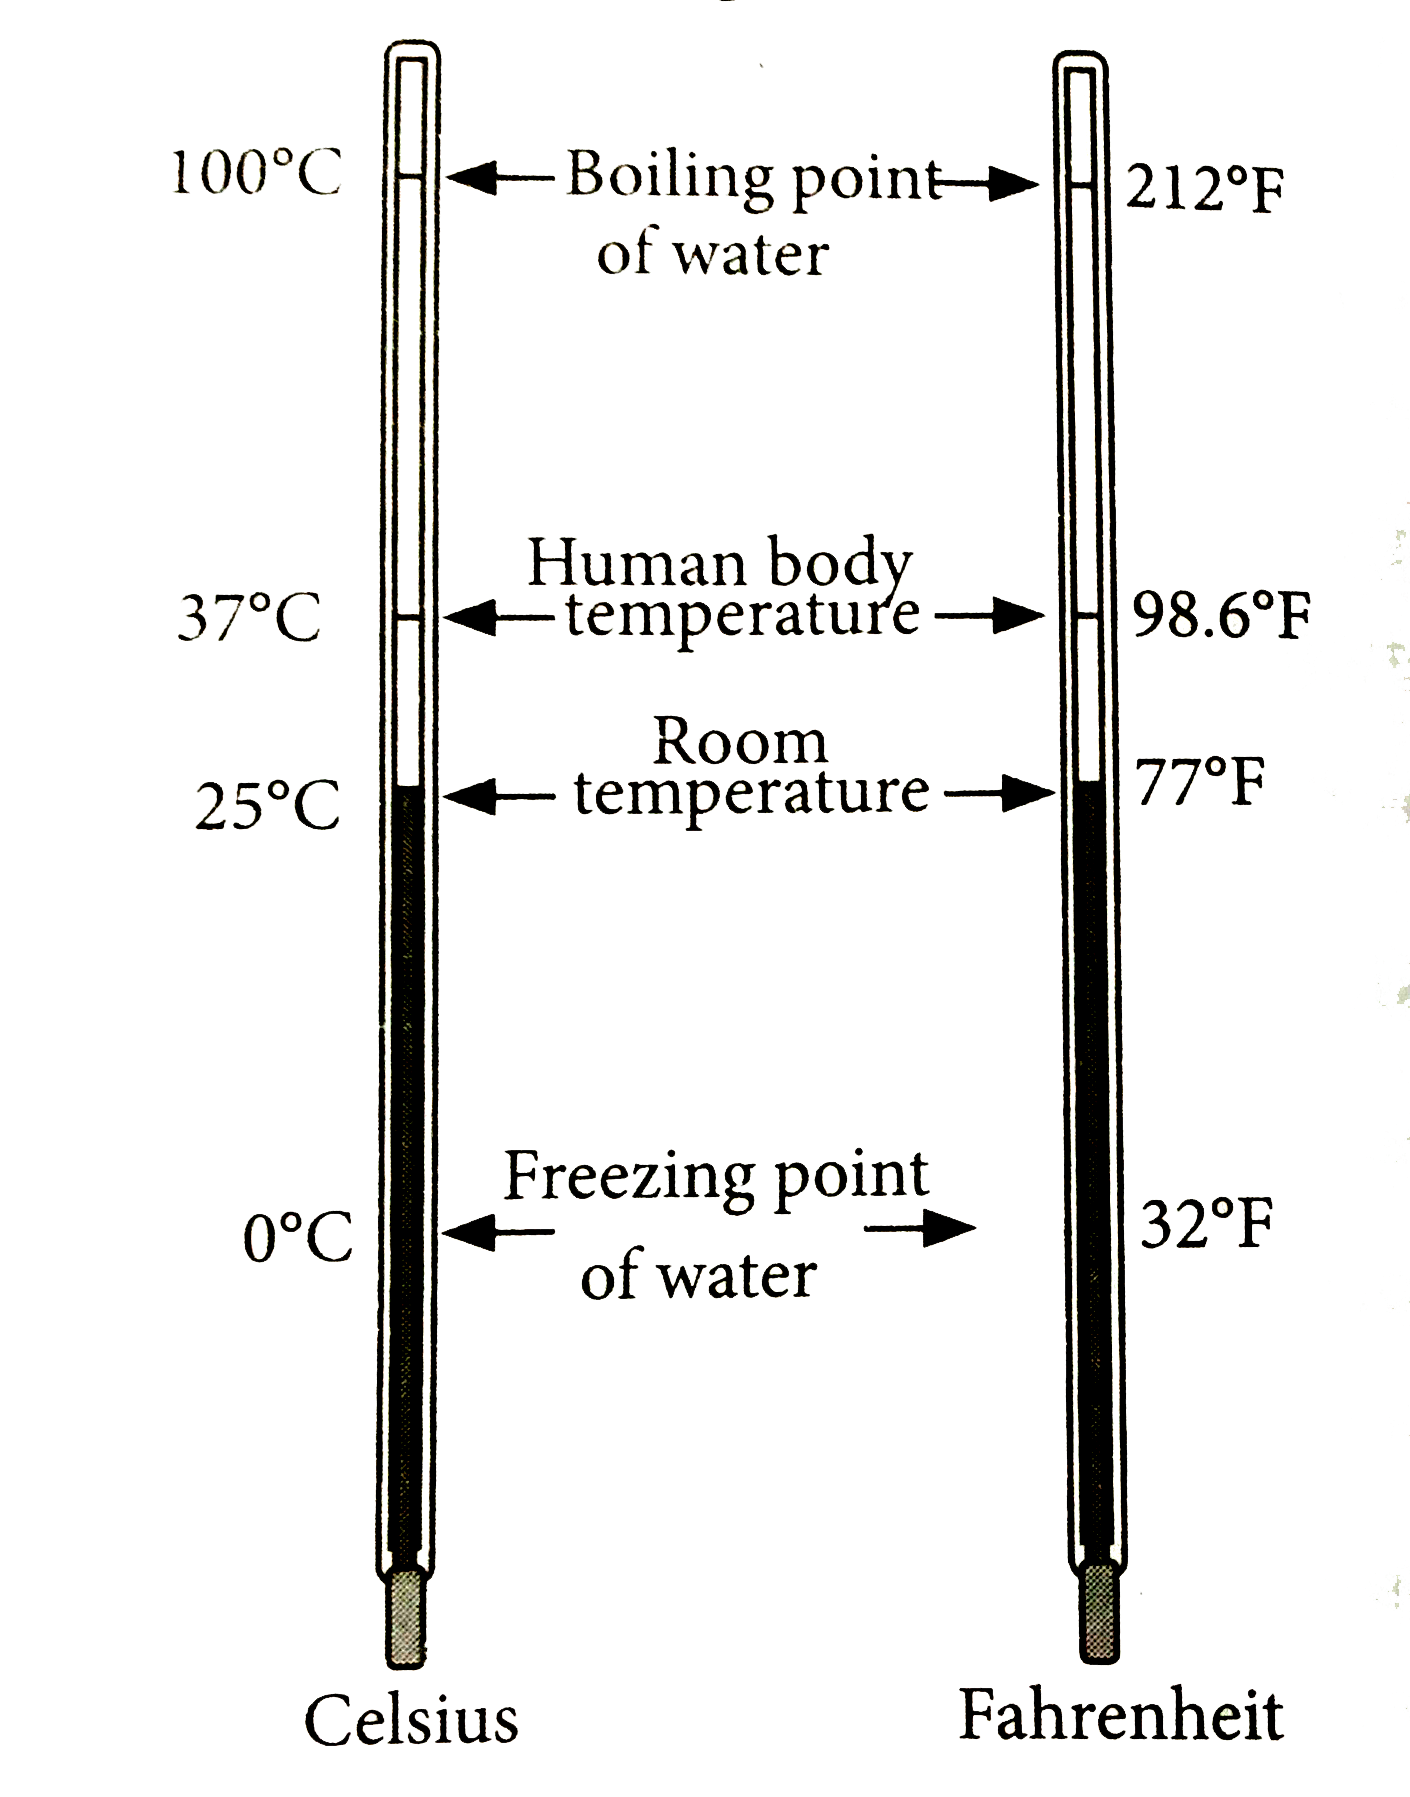
The correct relationship between fahrenheit and celsius scale is
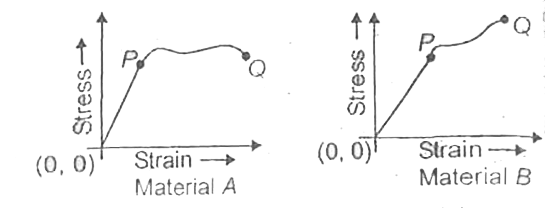
View SolutionThe stress-strain graphs for two materials A and are shown in figure. The graphs are drawn to the same scale. Select the correct statement
View Solution
