Given below is a graph showing change of potential difference occuring during conduction of nerve impulse through an axon, which one is correct about the shadded area-A in this graph :
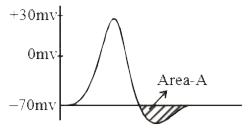
Shows depolarisation, due to opening of Na⊕ VGC
Shows repolarisation, due to opening of K⊕ VGC
Shows hyperpolarisation, due to on time closing of Na⊕ VGC and K⊕ VGC
Shows hyperpolarisation, due to late closing of K⊕ VGC
The correct Answer is:D
Step by step video & image solution for Given below is a graph showing change of potential difference occuring during conduction of nerve impulse through an axon, which one is correct about the shadded area-A in this graph : by Biology experts to help you in doubts & scoring excellent marks in Class 12 exams.
Updated on:21/07/2023Topper's Solved these Questions
Similar Questions
Knowledge Check
Given below is a bar graph showing the heights of six mountain peaks.
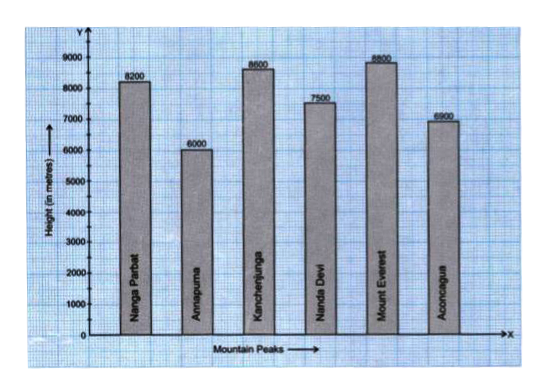
Read the above bar diagram and answer the following questions :
Which peak is second highest and what is it's height.AMount Everest, 8800 mBKanchan Junga, 8600 mCNanga Parbat, 8200 mDAnnapurma, 6000 m
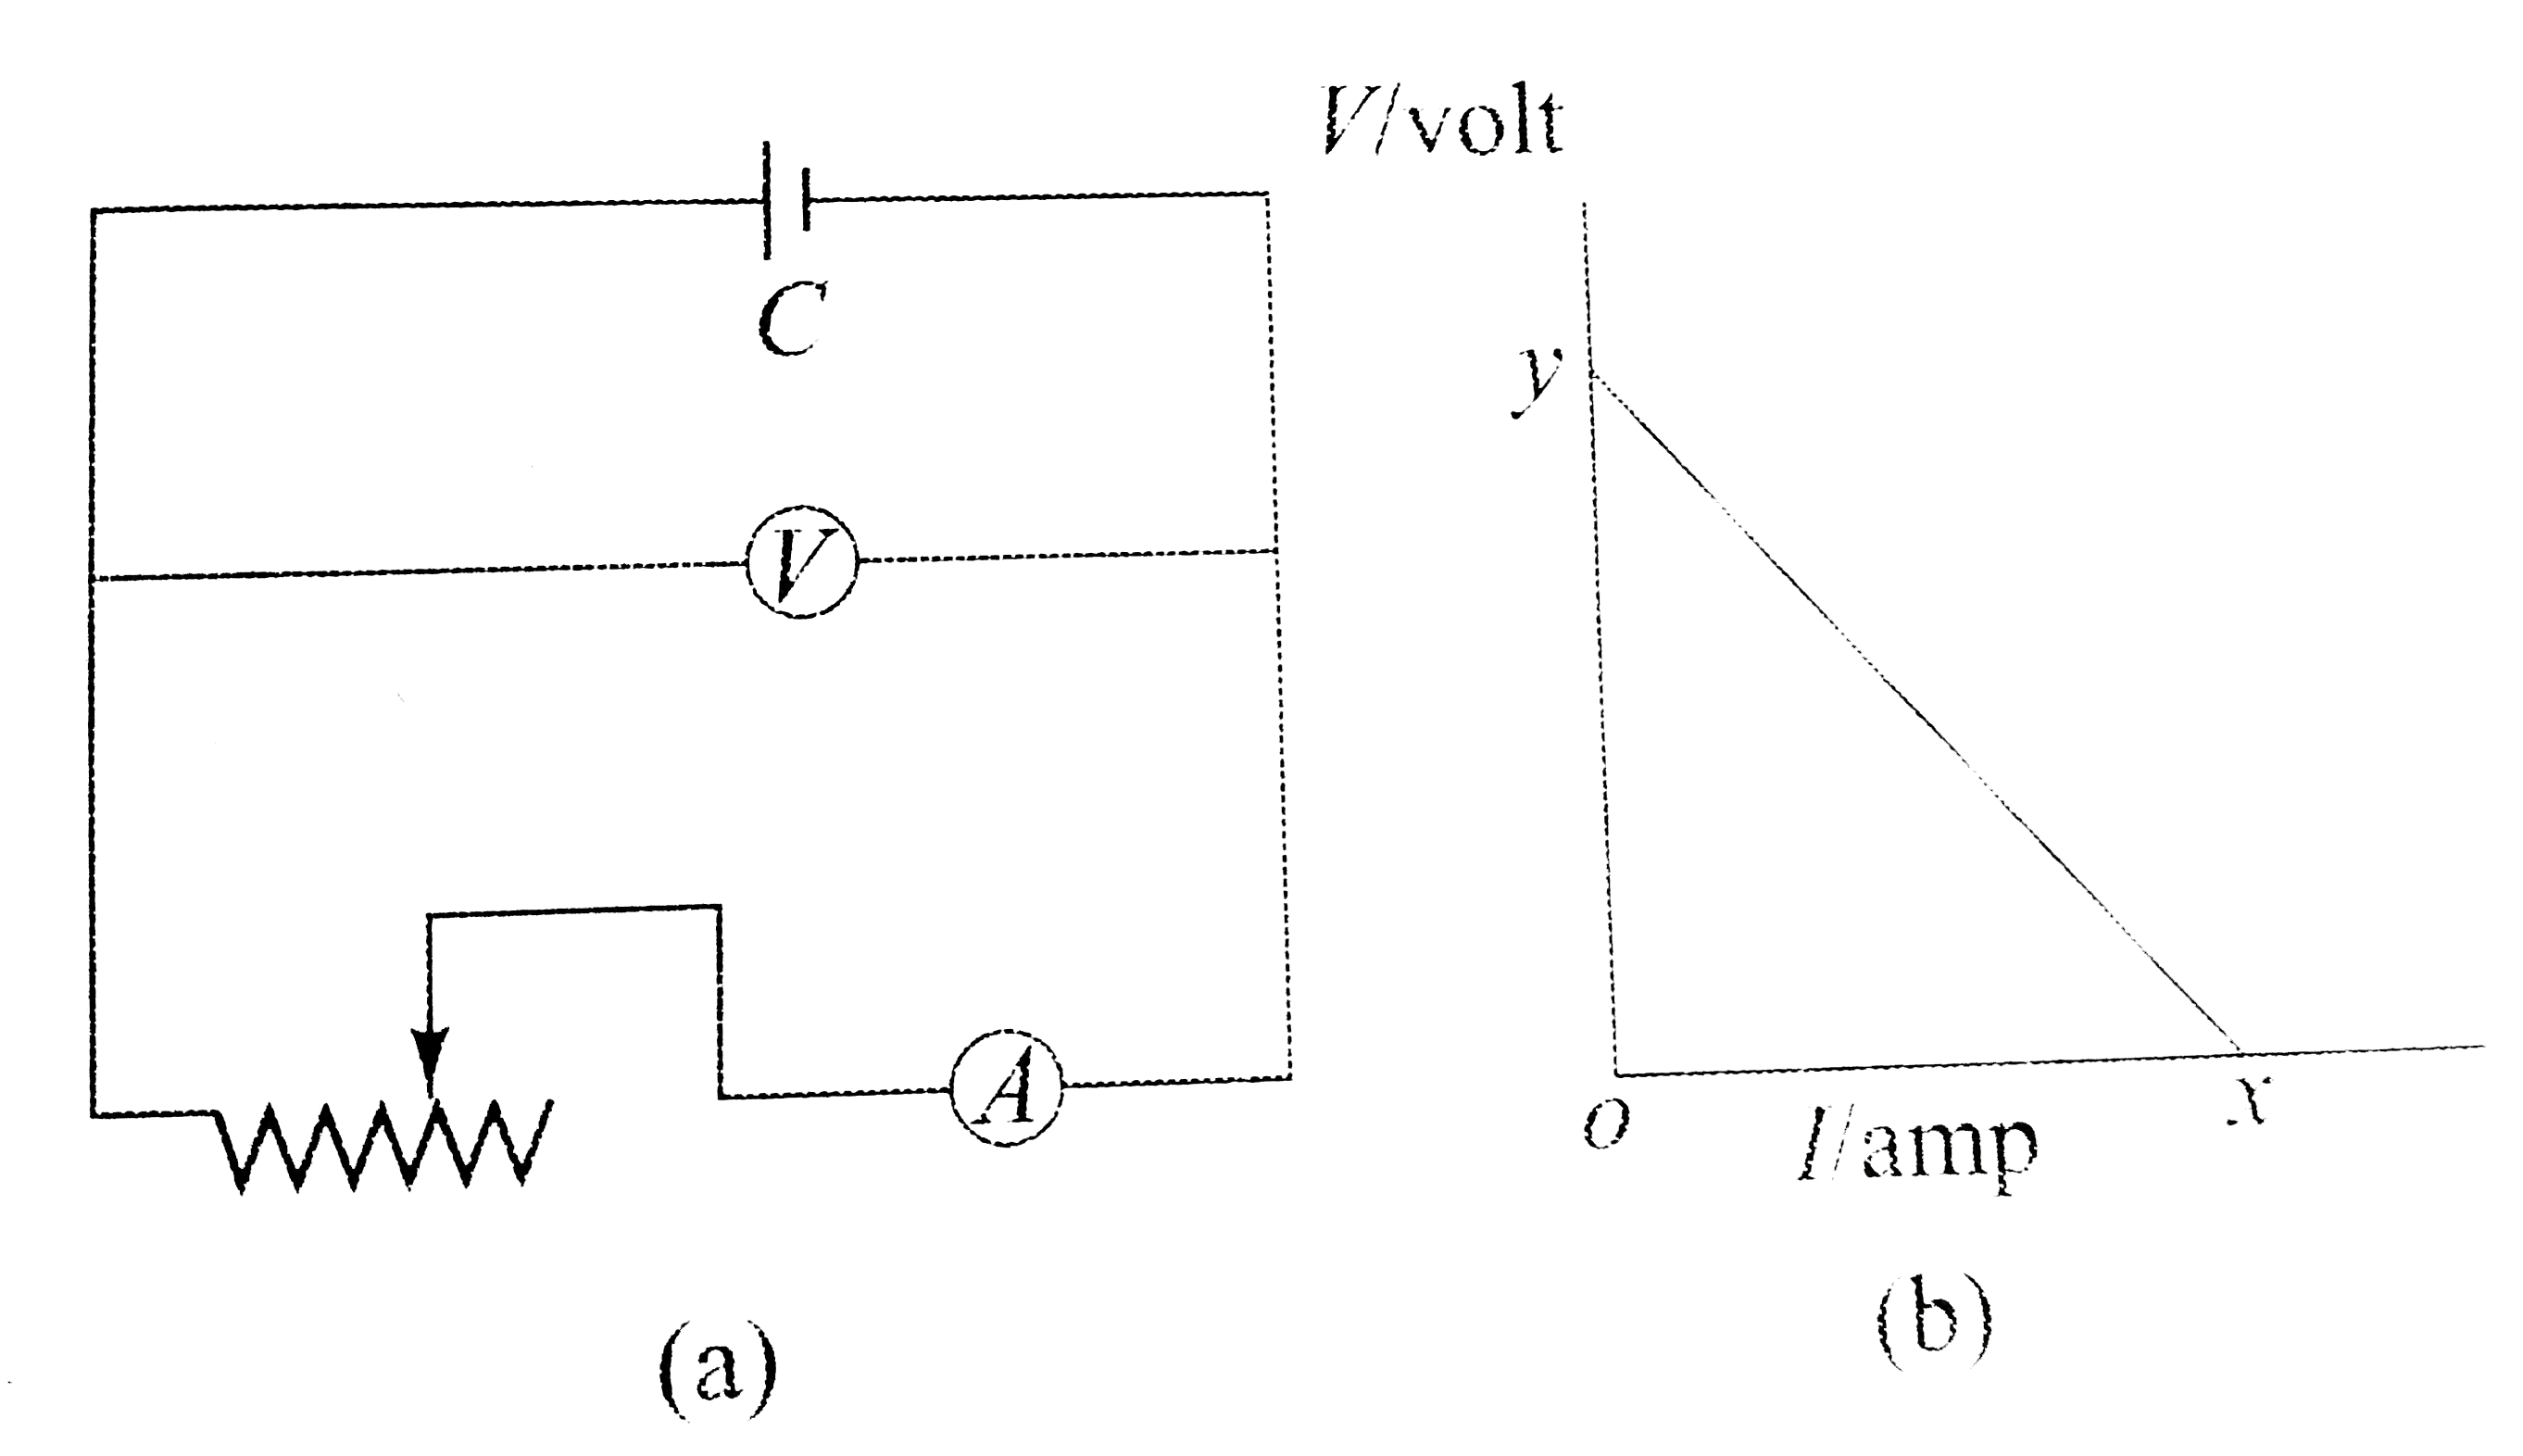
shows a circuit used in an experiment to detrmine the emf and interanl resistance of the battery C. A graph was plotted of the potential difference V between the terminals of the battery against the current I, which was varied by adjusting the rheostat. The graph is shown in x and y are the intercepts of the graph with the axes as shown. What is the internal resistance of the battery?
View SolutionGiven below is a diagram showing different parts of an eye
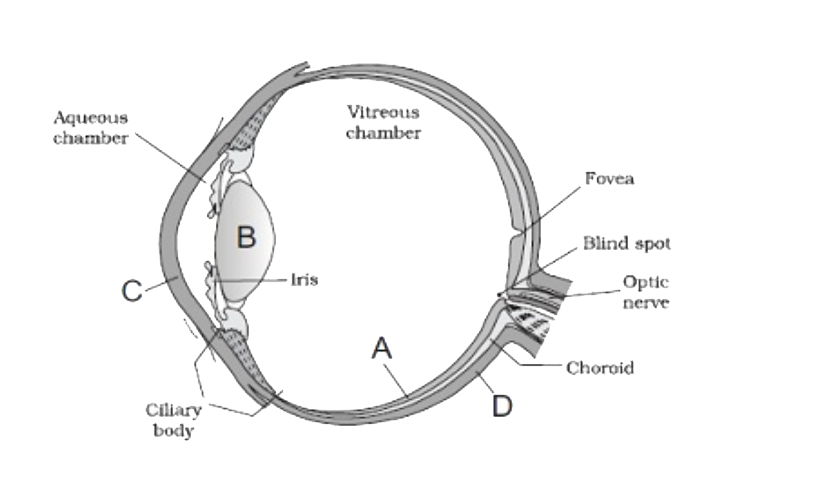
Some parts are labeled as A,B,C and D.
Read the following statements about these parts and choose the correct one
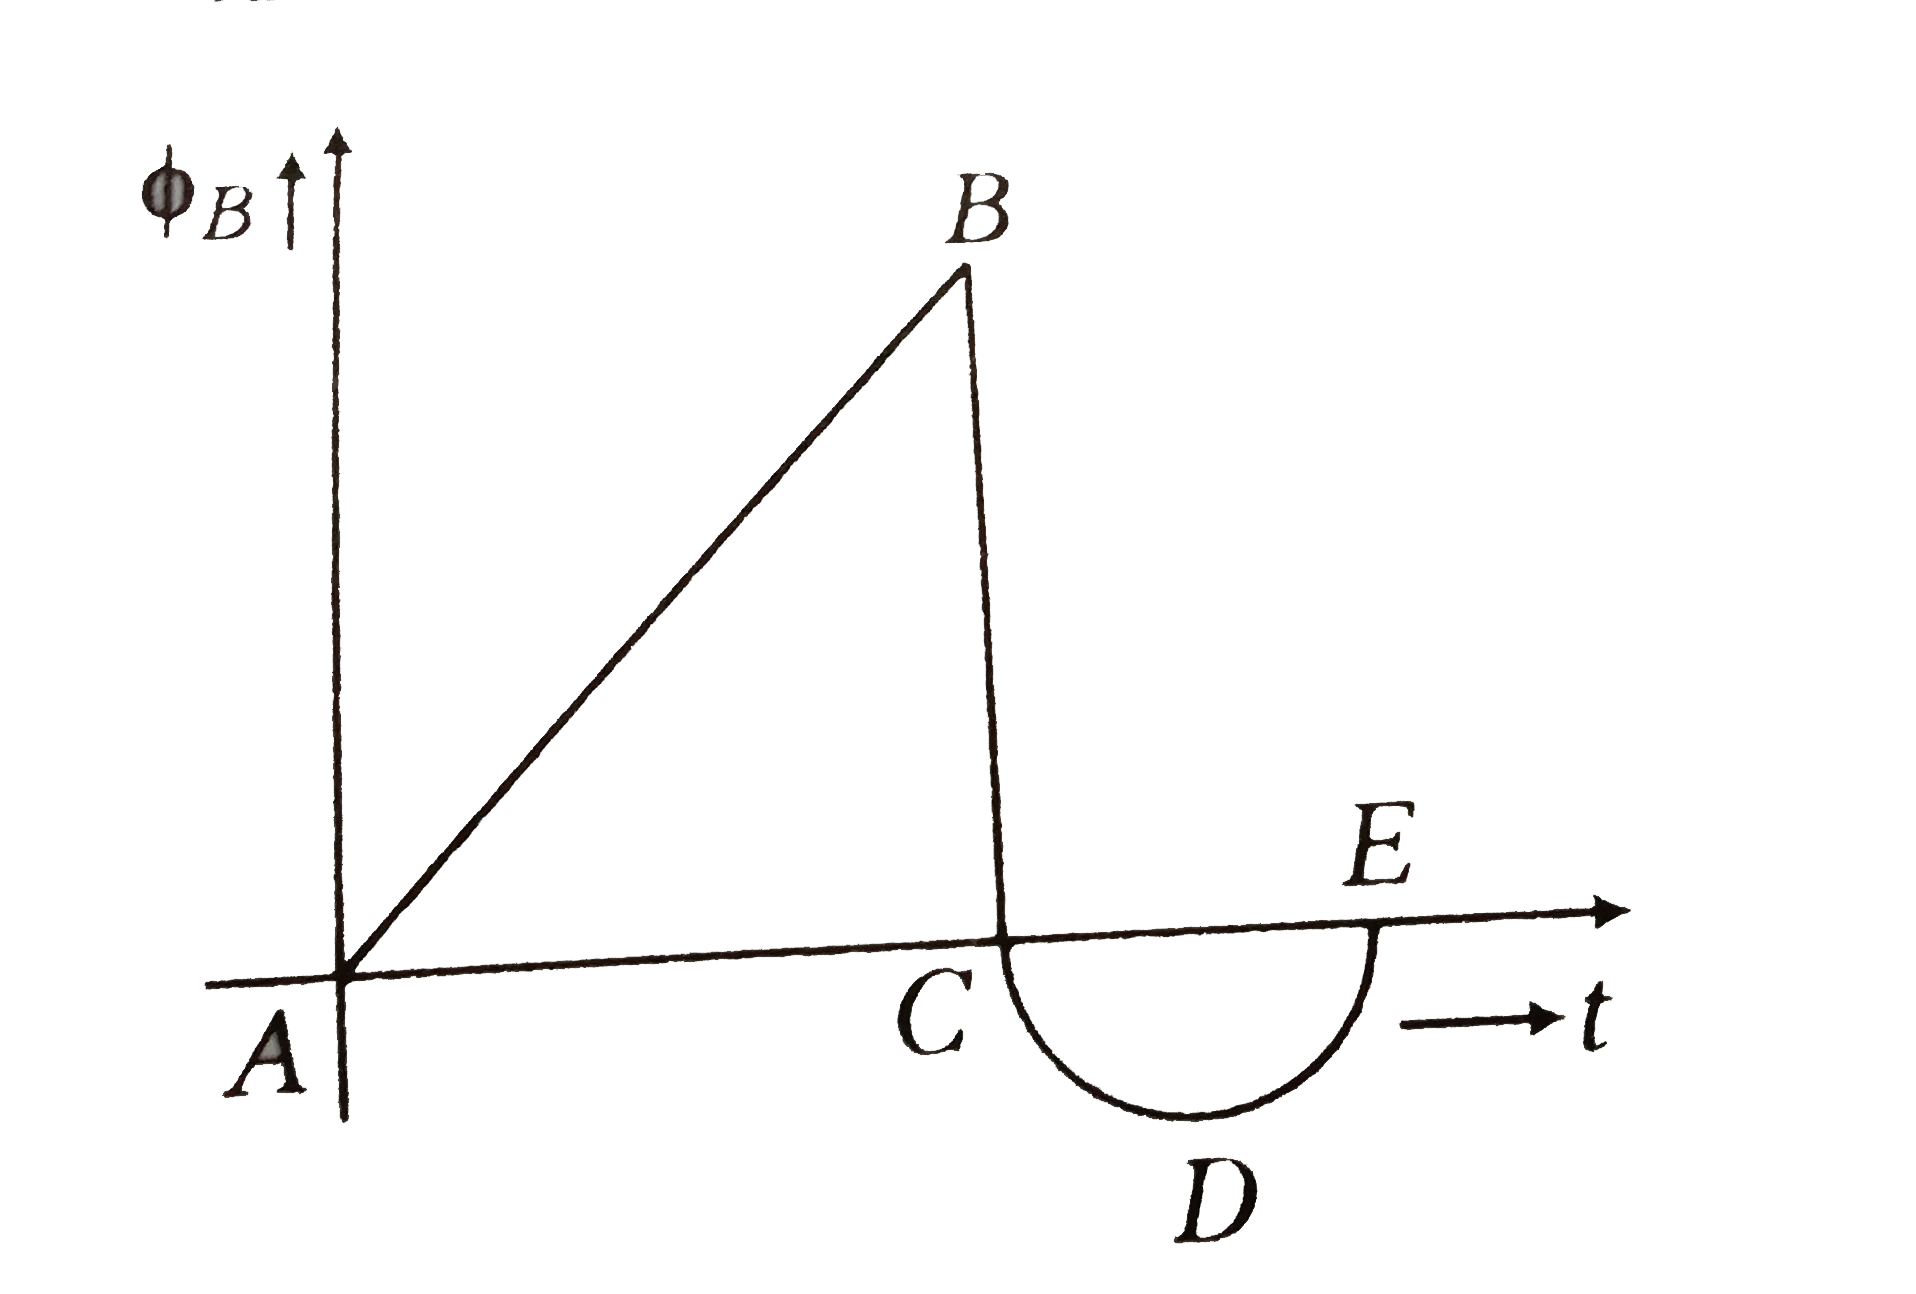
View SolutionThe graph shows the variation in magnetic flux ϕ(t) with time through a coil. Which of the statements given below in not correct?
View SolutionObserve the graph given below and answer the following questions:
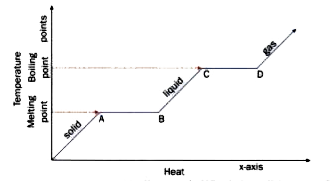
During vaporization of a liquid, certain amount of heat is absorbed without any change in temperature. Which part of the graph shows this change?
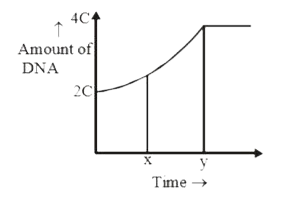
View SolutionThe given graph shows the change in DNA content in a single cell during the mitosis which stage occurs between the time x and y ?
View SolutionThe steps involved in the mechanism of vision are given below. Arrange them in proper sequence and select the correct option.
A. Dissociation of retinal from opsin and generation of potential difference in photoreceptor cells.
B. Focusing of the light rays in visible wavelength on the corner through the lens.
C. Generation of the action potential in ganglion cells through bipolar cells.
D. Analysis of neural impulse and formation of aa image on the retina.
E. Transmission of the action potential by the optic nerve to the visual cortex.
View SolutionThe given graph shows variation of charge .q. versus potential difference .V. for two capacitors
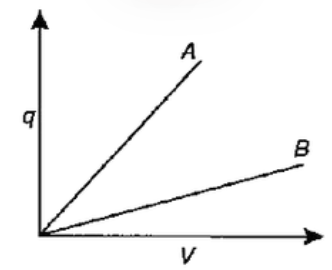
C1andC2. Both the capacitors have same plate separation but plate area of C2 is greater than that of C1. Which line (A or B) corresponds to C1 and why?
View Solution

