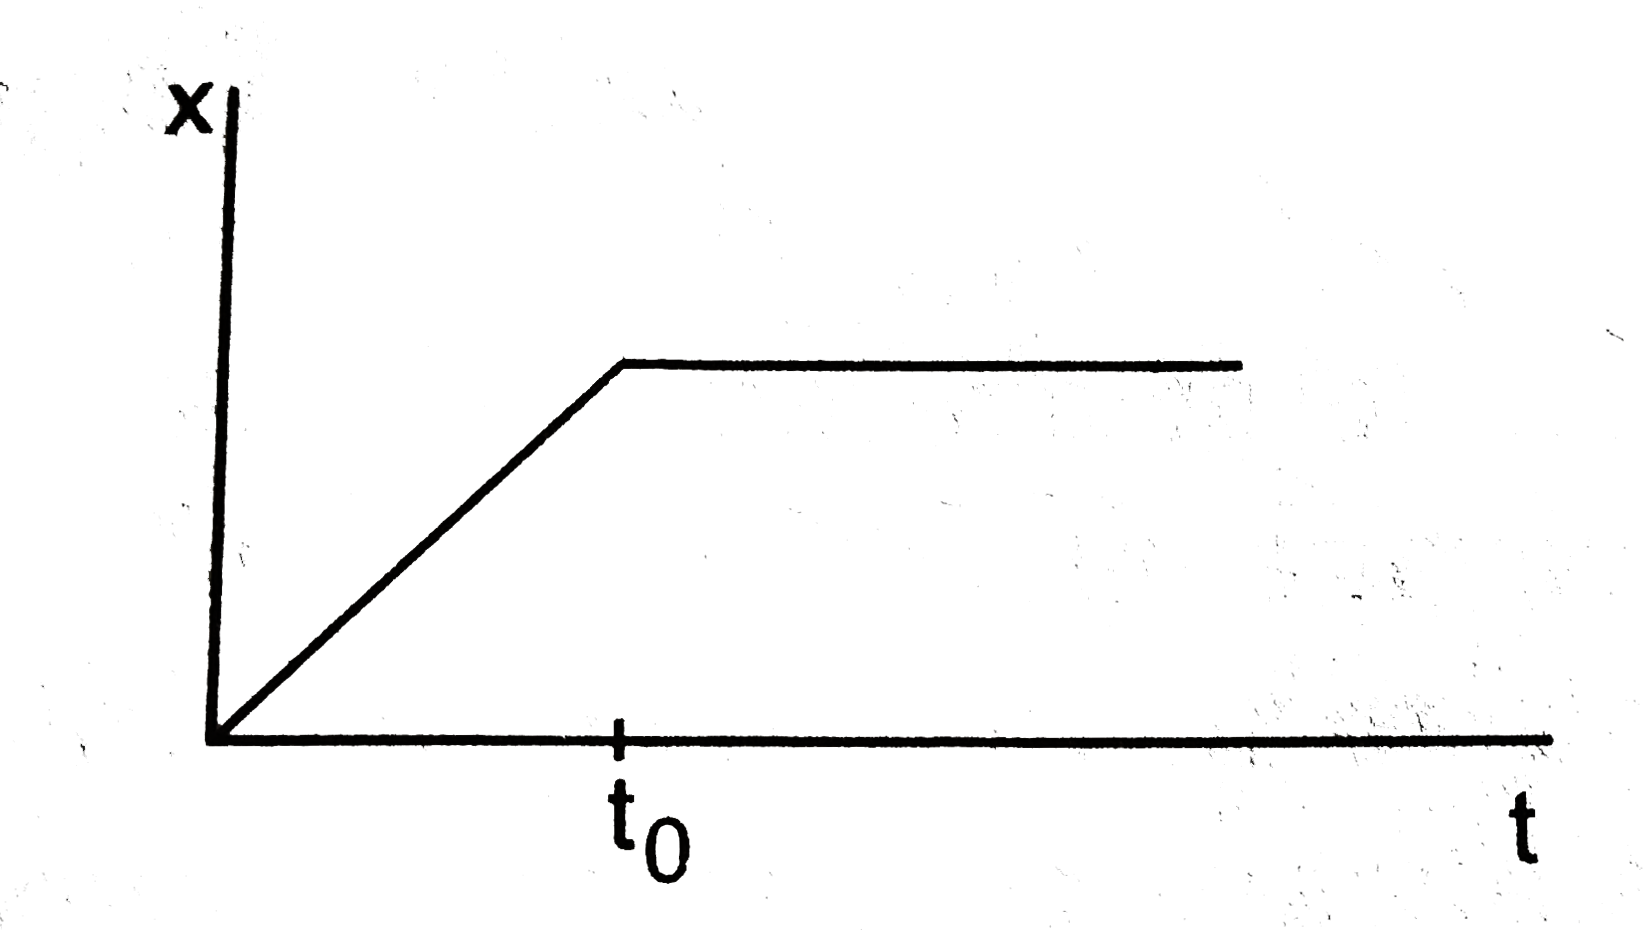
Figure shows two displacement-time graphs of particles and
Their relative velocity is

zero
non-zero but constant
continuously decreases
continuously increases
The correct Answer is:B
Step by step video & image solution for Figure shows two displacement-time graphs of particles P_(1) and P_(2) Their relative velocity is by Physics experts to help you in doubts & scoring excellent marks in Class 12 exams.
Updated on:21/07/2023Similar Questions
Knowledge Check
Which one of the following represents displacement-time graph of two objects A and B moving with zero relative velocity?
A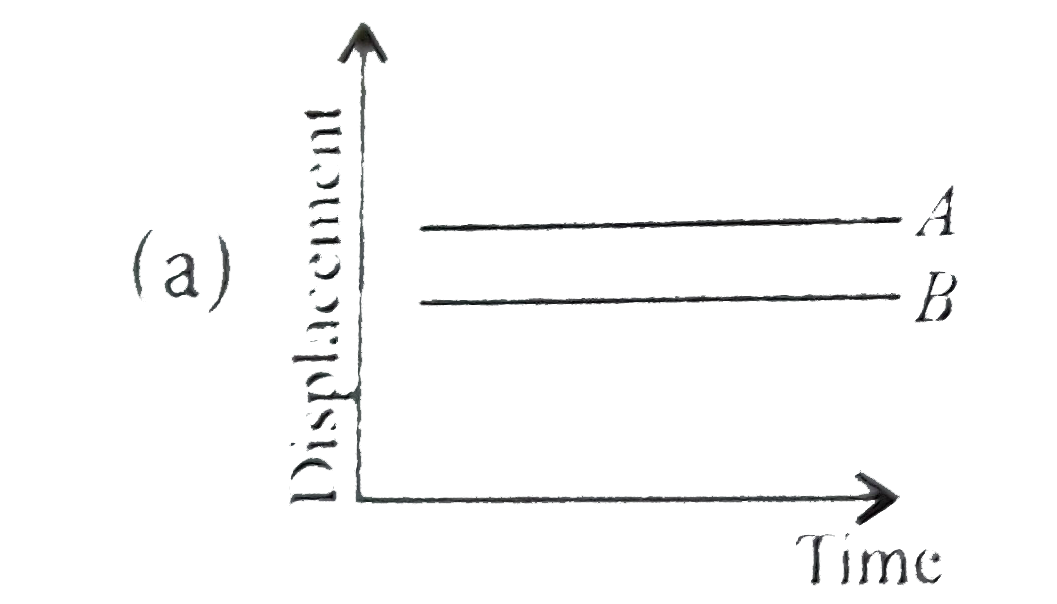 B
B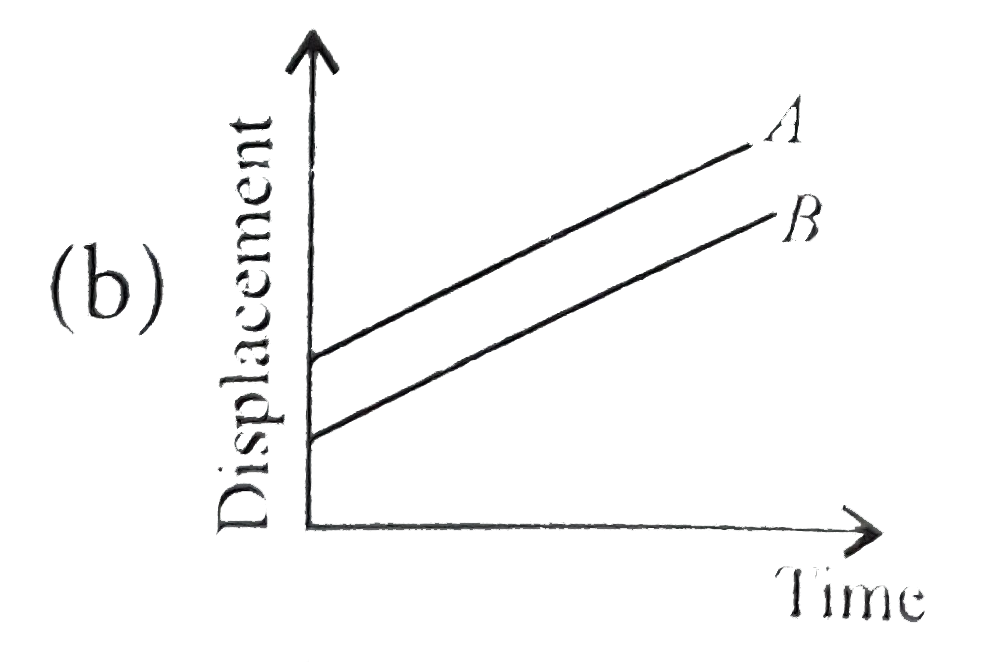 C
C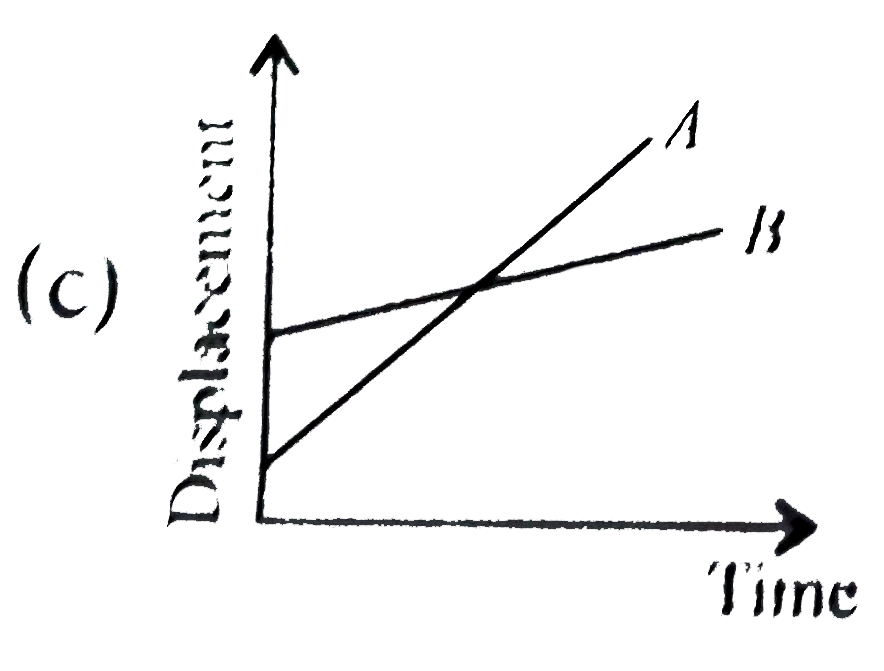 D
D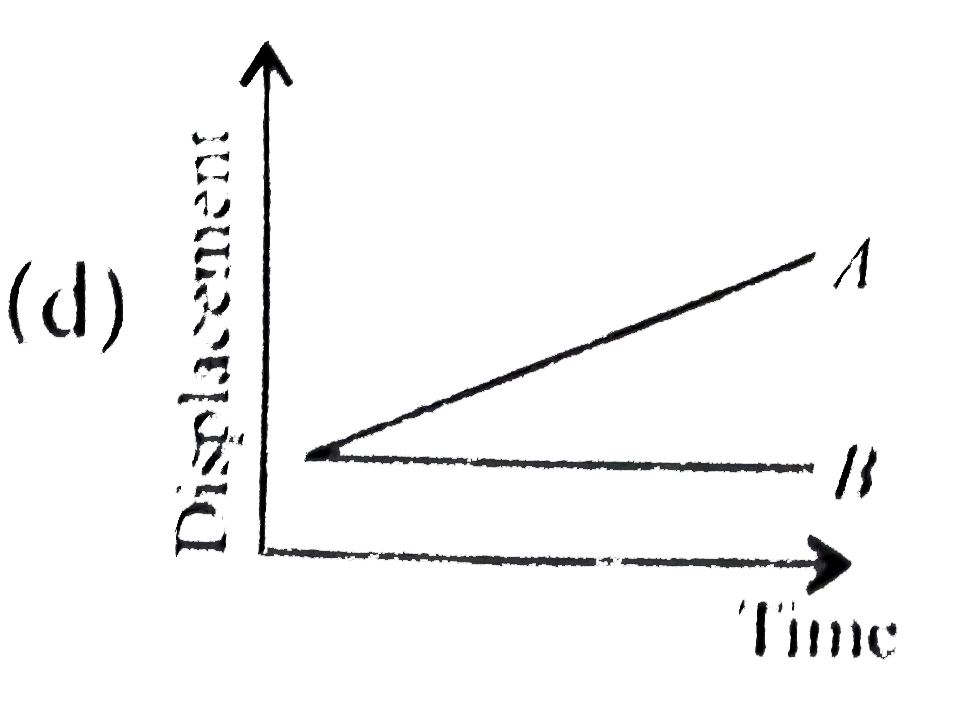
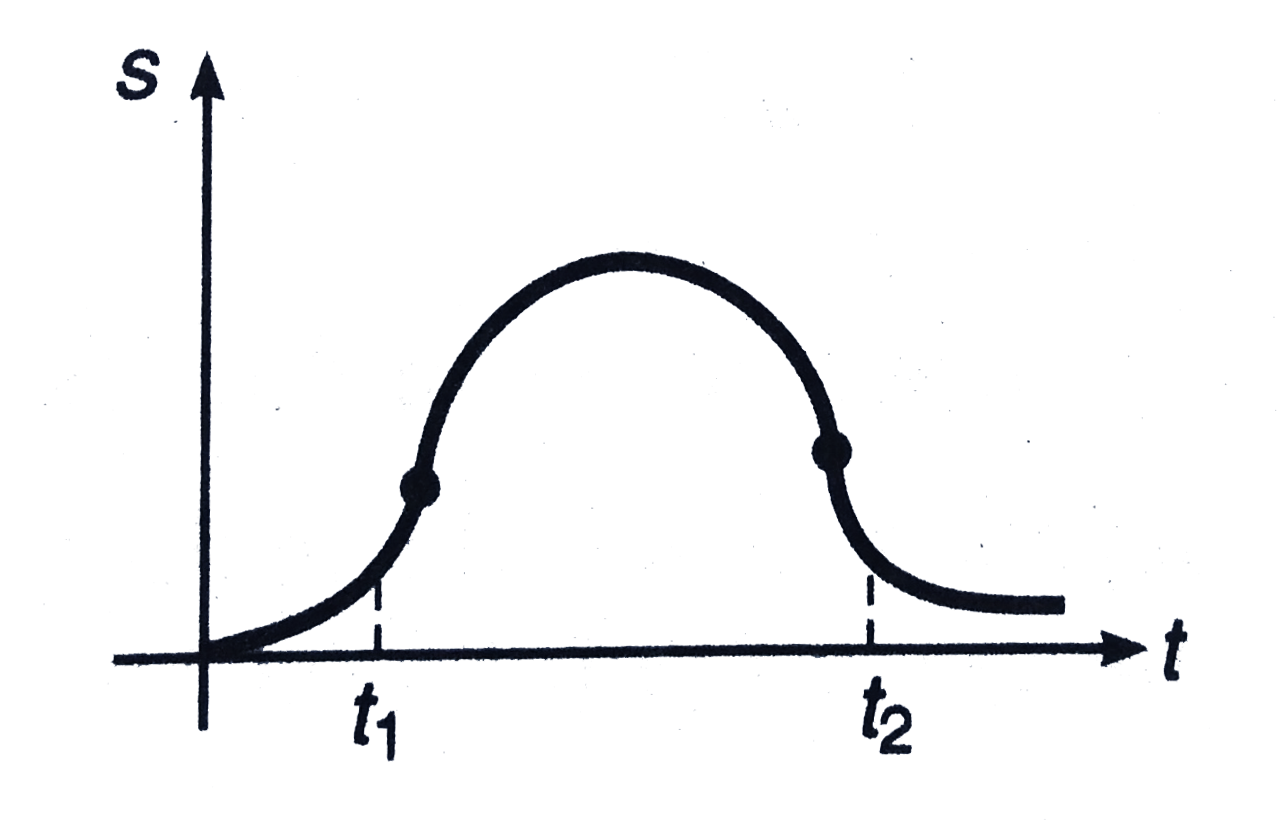
Figure shows the displacement-time graph of a particle moving in a straight line. Find the signs of velocity and acceleration of particle at time t=t1andt=t2.
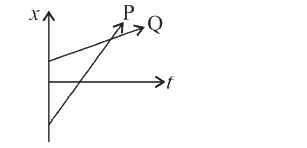
View SolutionFigure shows the displacement -time curve of the particles P and Q. Which of the following statement is correct ?
View SolutionThe figure shows the displacement-time graph of a particle executing SHM. If the time period of oscillation is 2s, then the equation of motion is given by
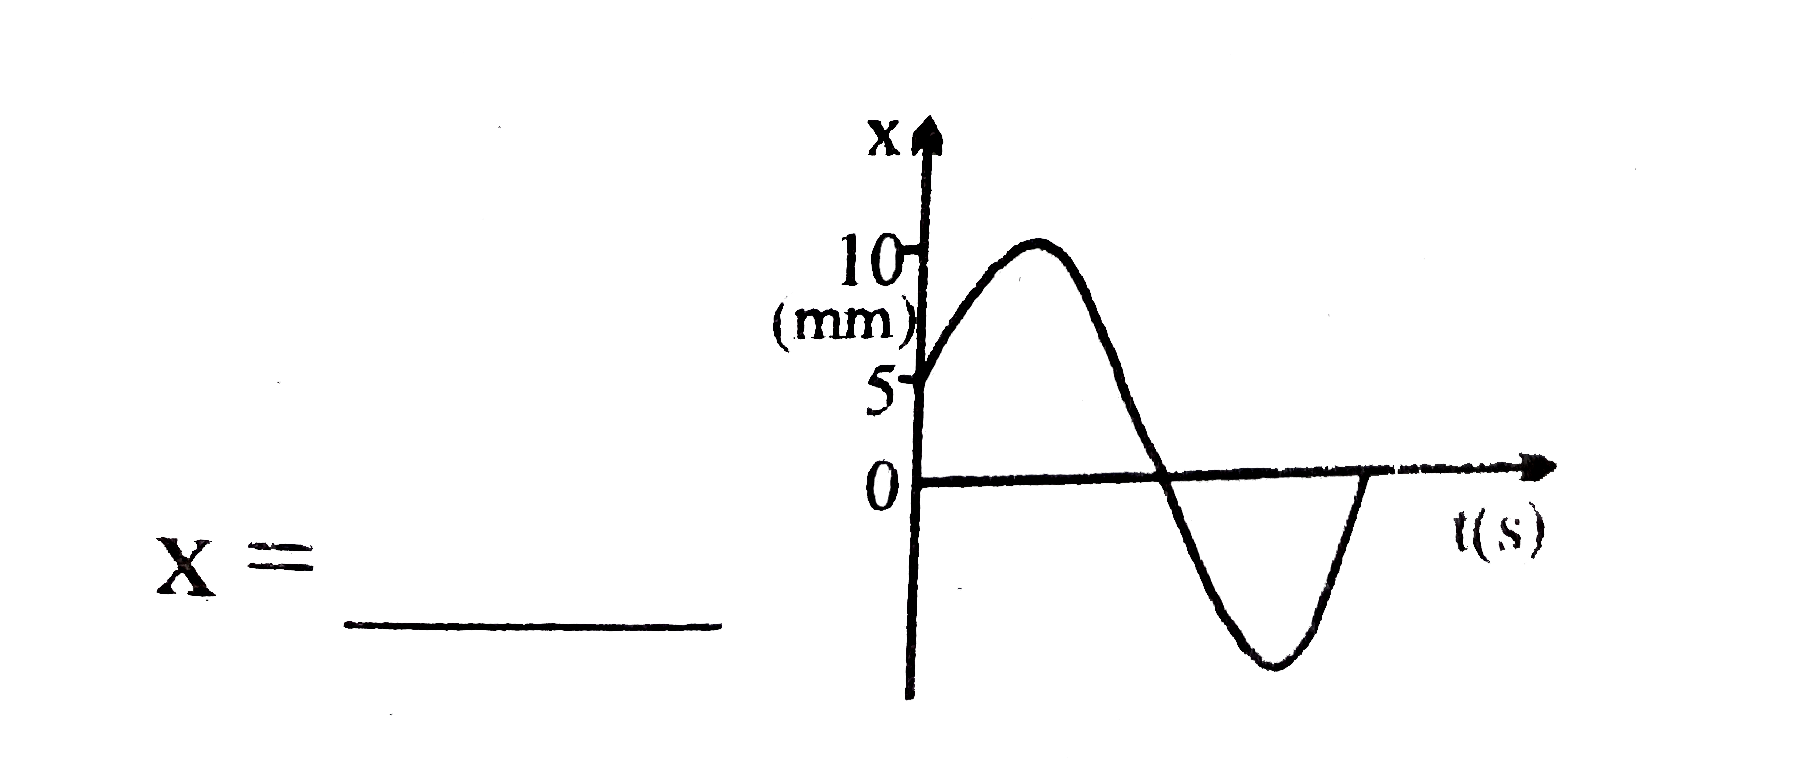
View SolutionThe figure shows the displacement-time graph of a particle executing SHM. If the time period of oscillation is 2s, then the equation of motion is given by

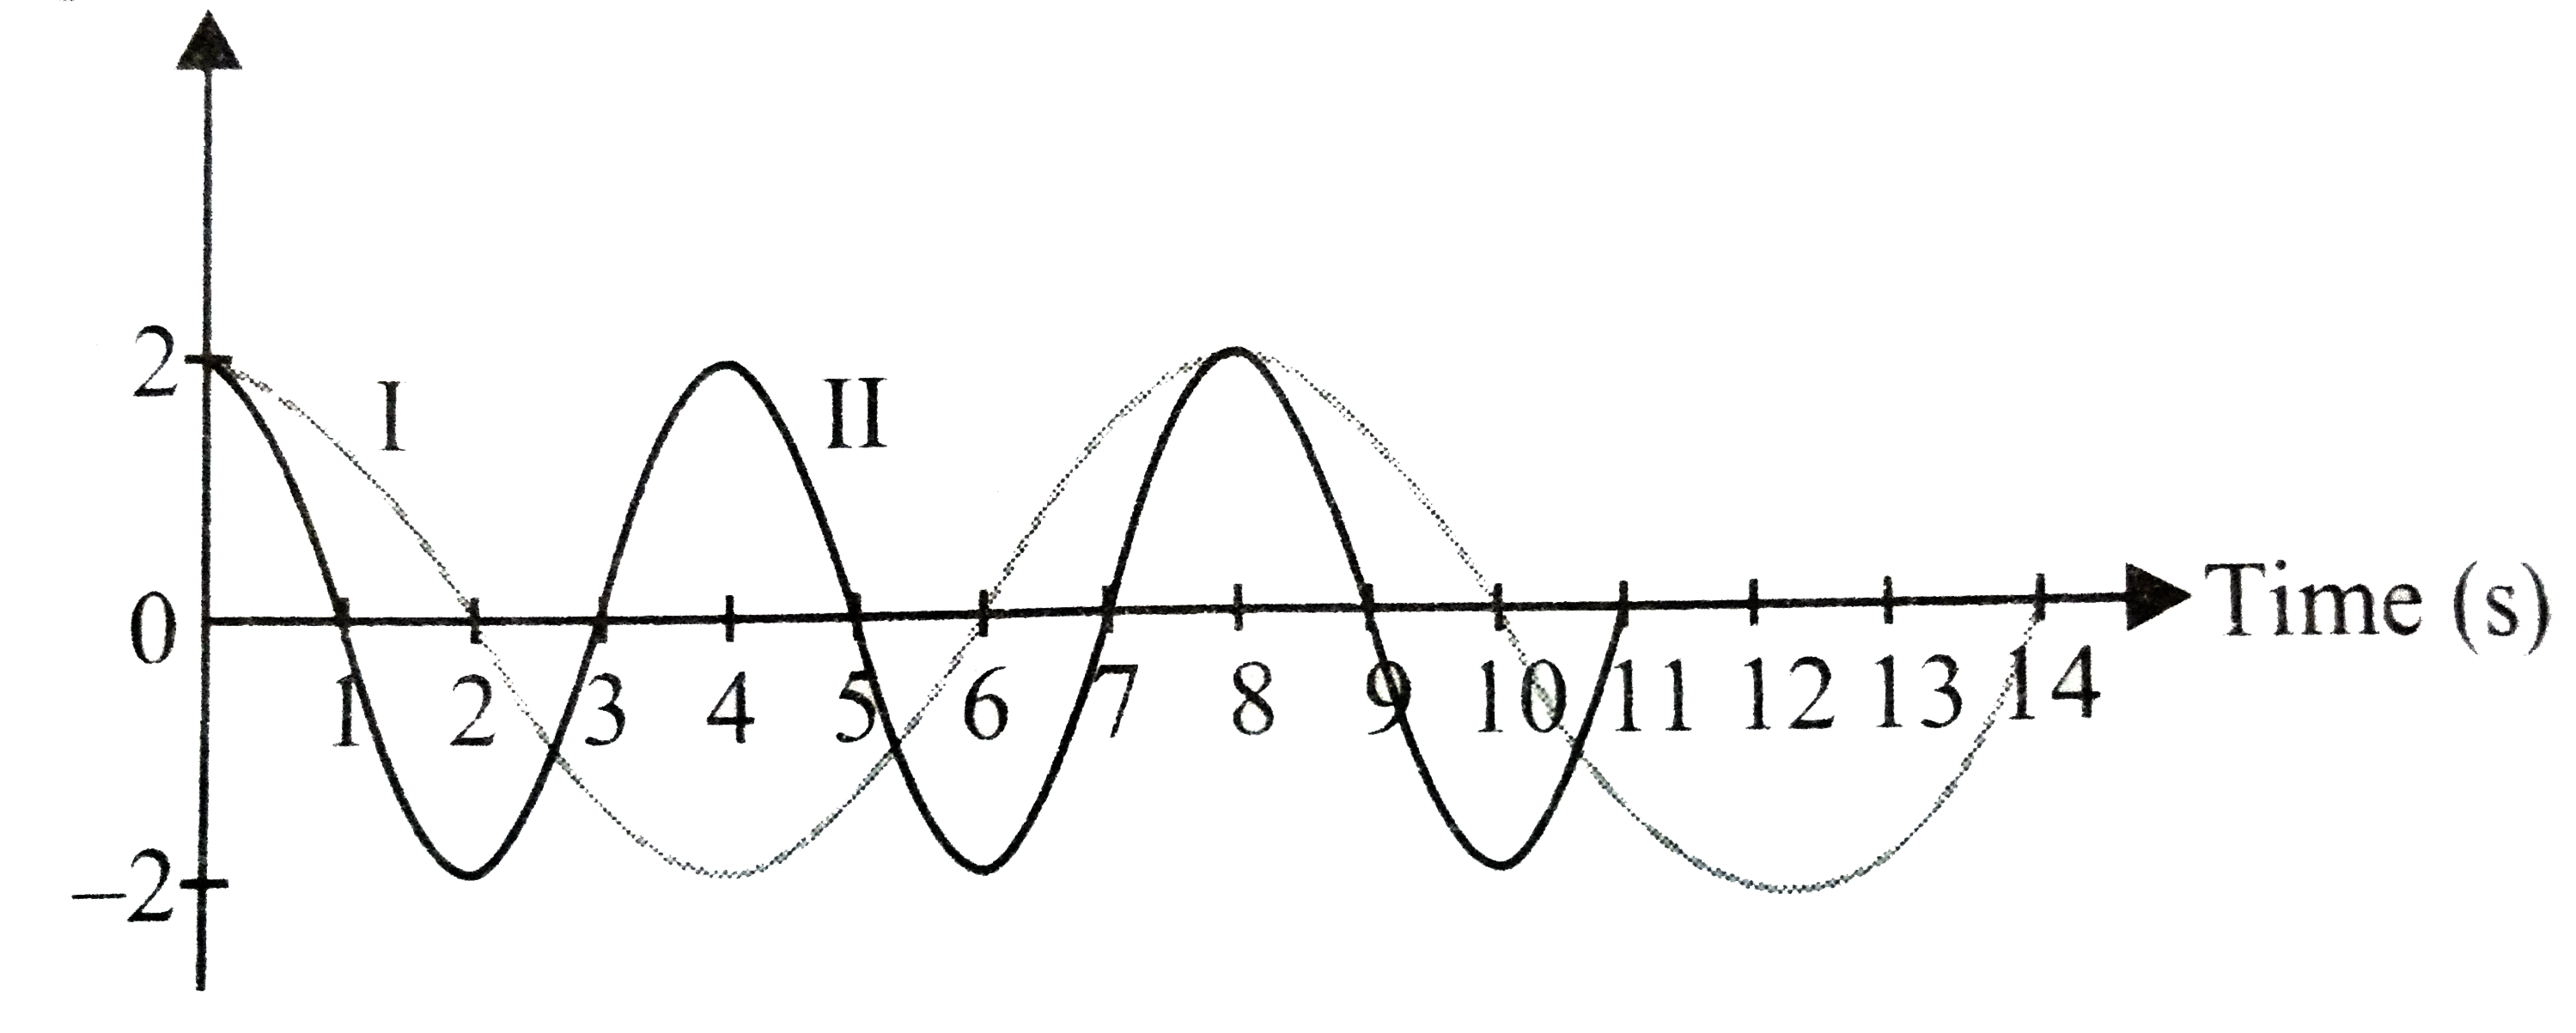
View SolutionFigure shows the displacement-time graphs of two simple harmonic motions I and II. From the graph it follows that
View Solution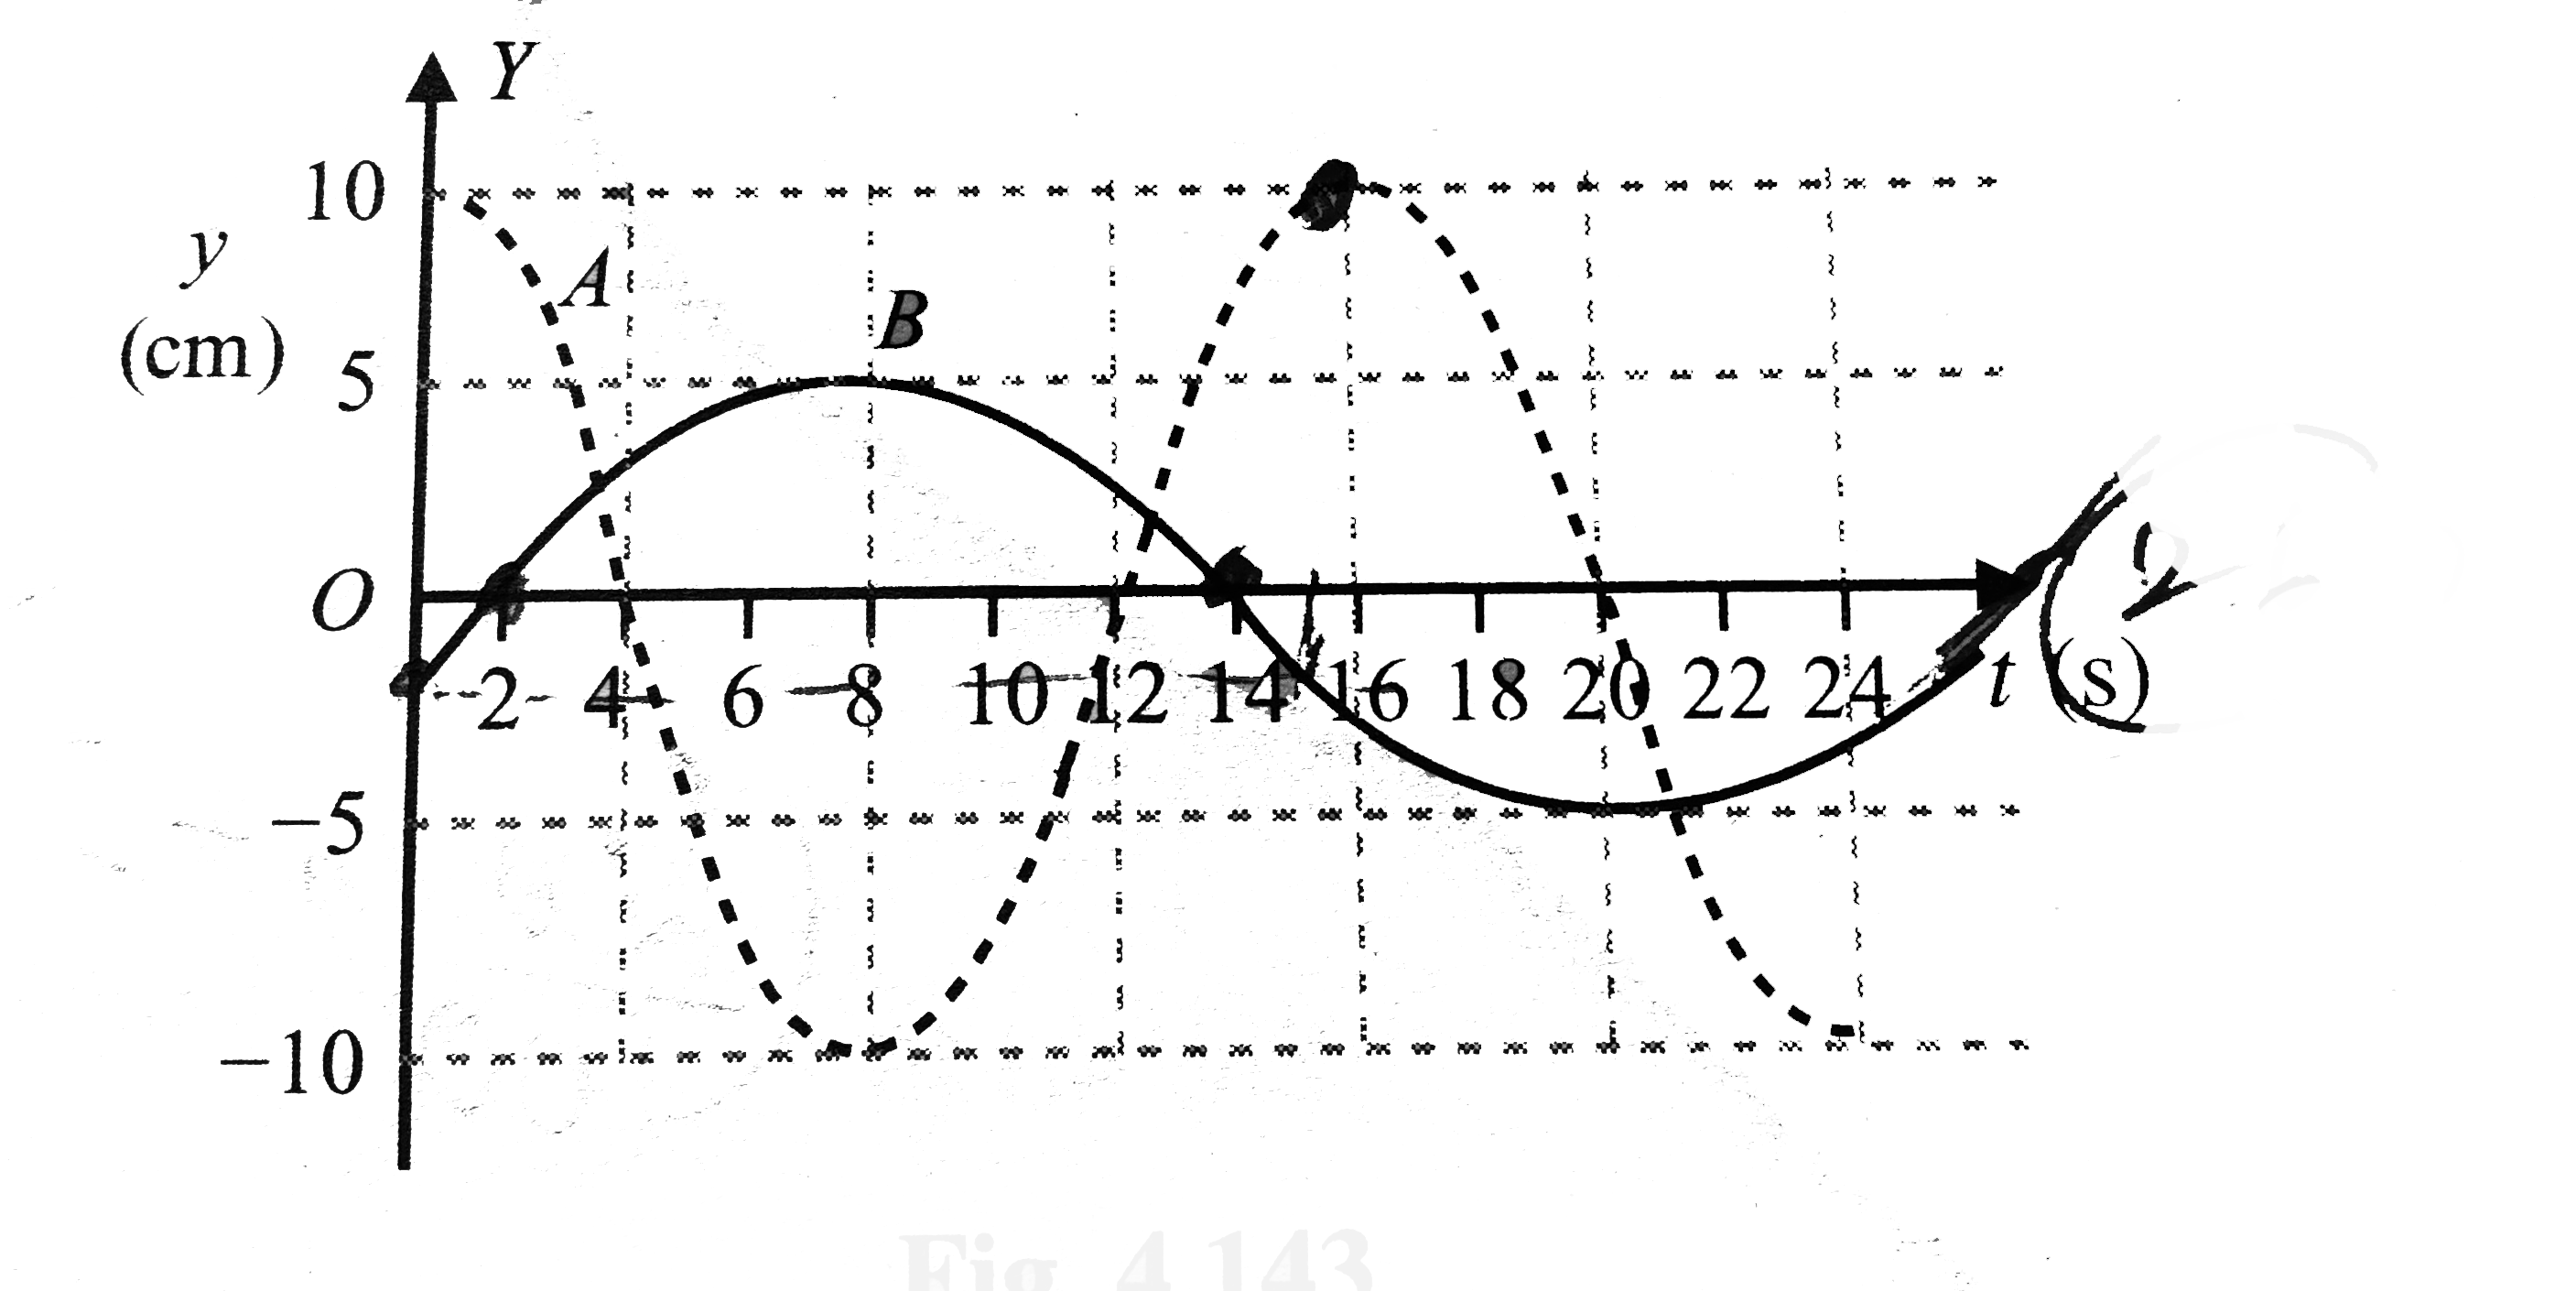
The following figure shows the displacement versus time graph for two particles A and B executing simple harmonic motions. The ratio of their maximum velocities is
View SolutionFigures (i) and (ii) below show the displacement - time graphs of two particles moving along the x-axis. We can say that

View Solution

