Quartile deviation for a frequency distribution is
Q=Q3−Q1
Q=12(Q3−Qi)
Q=13(Q3−Q1)
Q=14(Q2−Q1)
The correct Answer is:B
To find the quartile deviation for a frequency distribution, we follow these steps:
Step 1: Understand Quartiles
Quartiles divide a dataset into four equal parts. The first quartile (Q1) is the value below which 25% of the data fall, and the third quartile (Q3) is the value below which 75% of the data fall.
Step 2: Calculate Q1 and Q3
For a frequency distribution, we need to calculate Q1 and Q3 using the cumulative frequency.
1. Find the cumulative frequency for the data.
2. Locate Q1: This is found at the position N4, where N is the total number of observations.
3. Locate Q3: This is found at the position 3N4.
Step 3: Use the Quartile Deviation Formula
The formula for quartile deviation (QD) is given by:
QD=12(Q3−Q1)
Step 4: Substitute Values
Once you have the values of Q1 and Q3 from the previous step, substitute them into the formula to calculate the quartile deviation.
Step 5: Interpret the Result
The quartile deviation gives a measure of the spread of the middle 50% of the data. A smaller quartile deviation indicates that the data points are closer to the median.
Example Calculation
Assuming you have calculated Q1 = 10 and Q3 = 20:
1. Substitute into the formula:
QD=12(20−10)=12×10=5
Final Answer
Thus, the quartile deviation for the frequency distribution is 5.
---
Quartiles divide a dataset into four equal parts. The first quartile (Q1) is the value below which 25% of the data fall, and the third quartile (Q3) is the value below which 75% of the data fall.
For a frequency distribution, we need to calculate Q1 and Q3 using the cumulative frequency.
2. Locate Q1: This is found at the position N4, where N is the total number of observations.
3. Locate Q3: This is found at the position 3N4.
The formula for quartile deviation (QD) is given by:
Once you have the values of Q1 and Q3 from the previous step, substitute them into the formula to calculate the quartile deviation.
The quartile deviation gives a measure of the spread of the middle 50% of the data. A smaller quartile deviation indicates that the data points are closer to the median.
Assuming you have calculated Q1 = 10 and Q3 = 20:
QD=12(20−10)=12×10=5
Thus, the quartile deviation for the frequency distribution is 5.
Similar Questions
What is the algebraic sum of deviations of a frequency distribution about its mean?
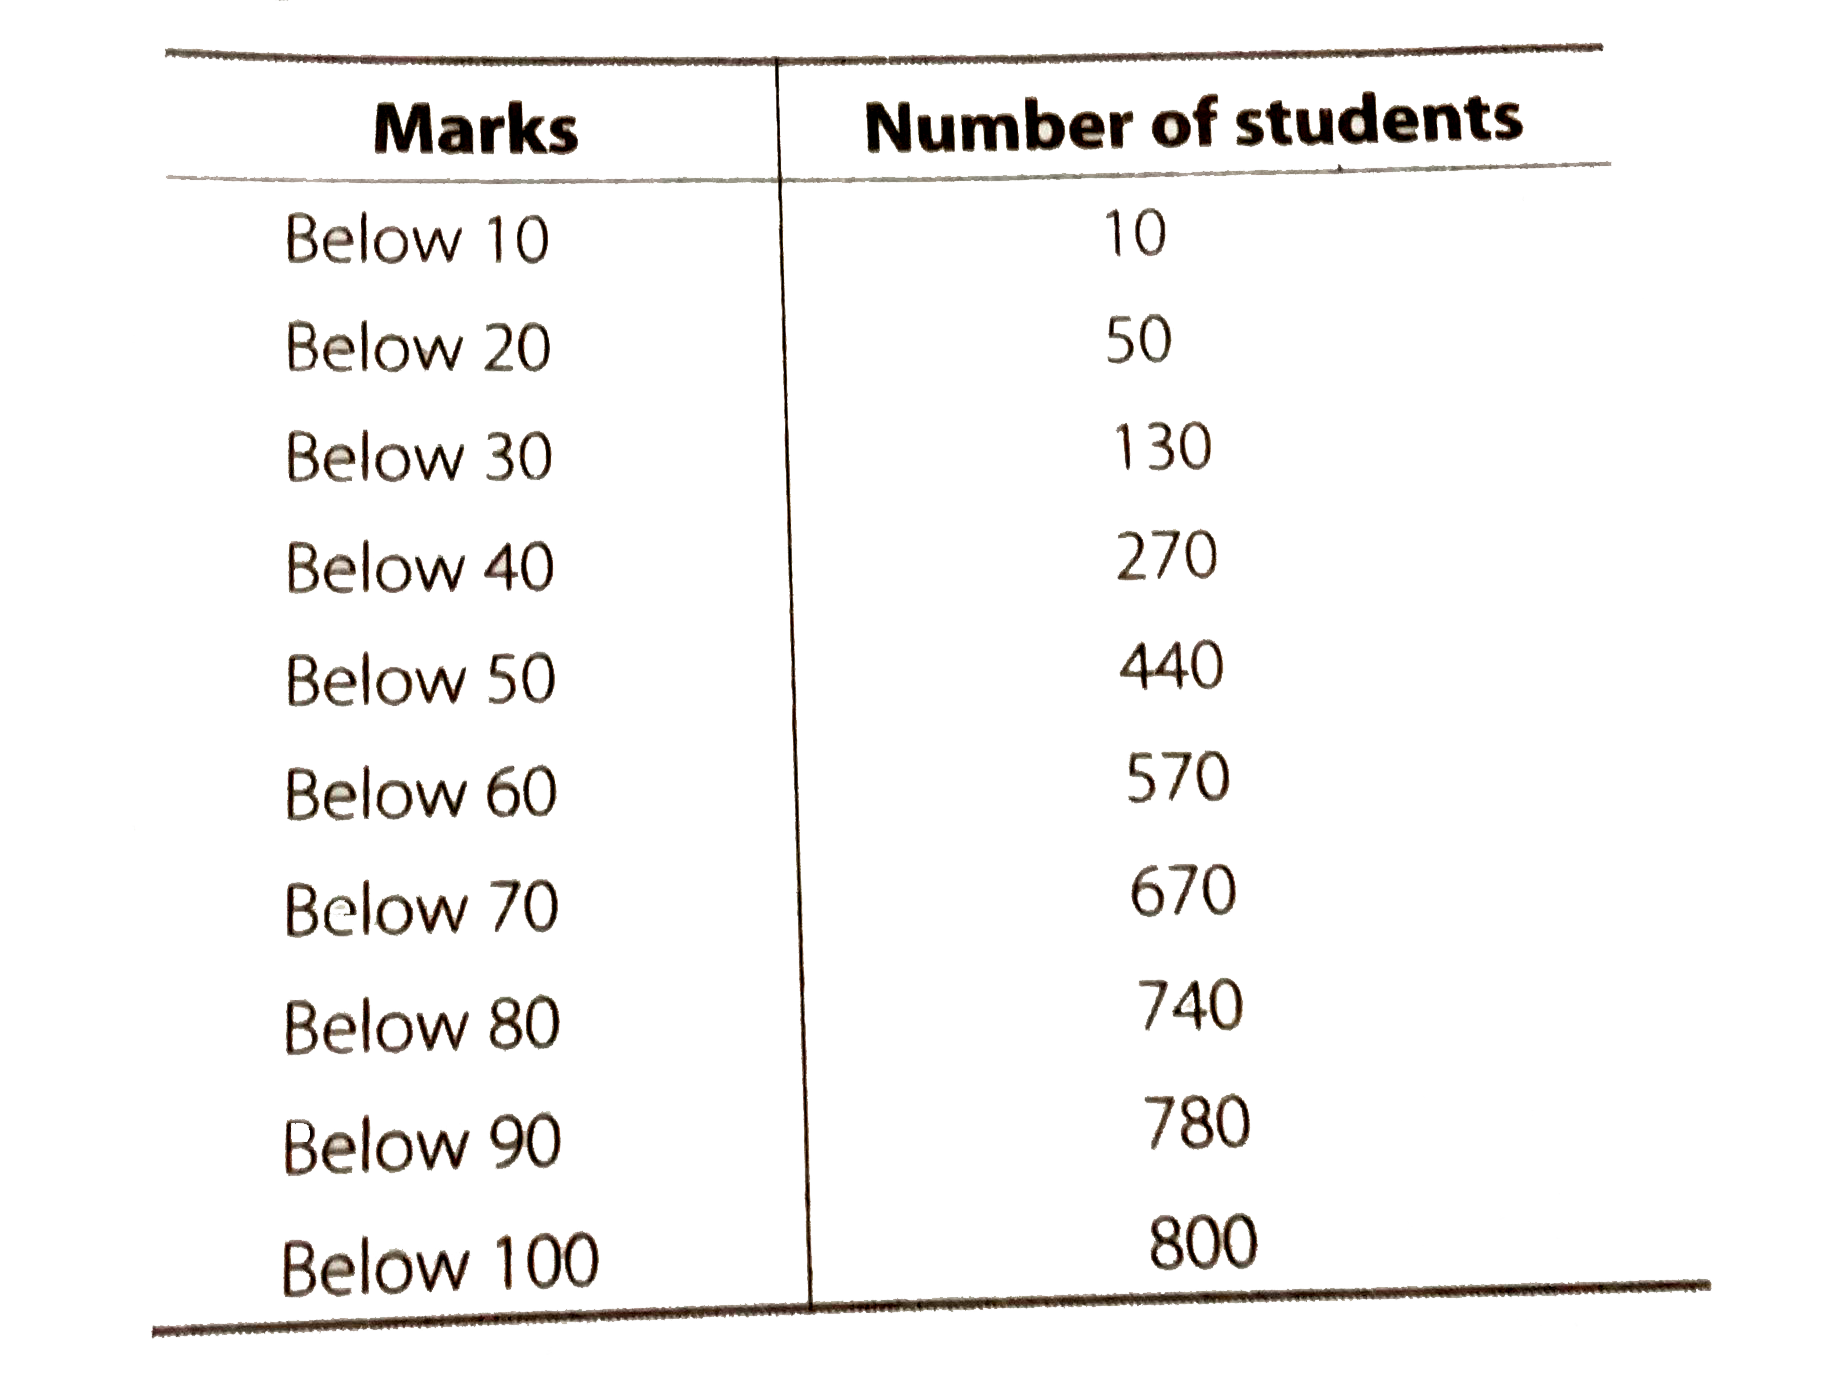
View SolutionThe following table show tha cumulative frequency distribution of marks of 800 students in an examination.

Construct a frequency distribution table for the data above.
View SolutionEstimate standard deviation for the following frequency distribution.

View SolutionFind The standard deviation of the following frequency distribution is
X234567f491614116
View SolutionFind the mean deviation from the median for following frequency distribution :

View SolutionFind the mean and standard deviation of the following frequency distribution :

View SolutionCalculate mean, variance and standard deviation of the following frequency distribution: Class 1-10 10-20 20-30 30-40 40-50 0-60 Frequency: 11 29 18 4 5 3
View SolutionCumulative Frequency Distribution
View SolutionCalculate the mean deviation from the mean for the following frequency distributions.

View SolutionCalculate the mean deviation from the mean for the following frequency distributions.

View Solution
