Following two graphs are based on the conductometric titration of acid-base reaction. Answer the questions given at the end of it.

Select correct statement,
Graph A is for weak monobasic acid while graph B is for monobasic strong acid
Graph A is for strong monobasic add and graph B is for weak dibasic acid
Graph A is for weak monobasic acld and graph B is for weak dibasic acid
Graph A is for strong monobasic acid and graph B is for weak monobasic acid
The correct Answer is:D
Step by step video & image solution for Following two graphs are based on the conductometric titration of acid-base reaction. Answer the questions given at the end of it. Select correct statement, by Chemistry experts to help you in doubts & scoring excellent marks in Class 12 exams.
Updated on:21/07/2023Similar Questions
Knowledge Check
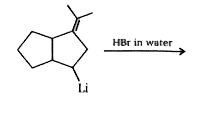
In Which of the following reaction an acid-base reaction takes place ?
A B
B C
C DAll of these
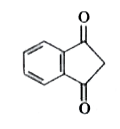
Which of the following compounds exhibit acid base reaction with NaOH?
A B
B C
C D
D
With respect to the titration of acid and base. Answer the following questions :
Which solution is taken in the burette ?
View SolutionWith respect to the titration of acid and base. Answer the following questions :
Which solution is taken in the flask ?
View Solutionwhich of the following plots will obtained for a conductometric titration of strong acid against a weak base?
View SolutionWhich of the following is possible acid base reaction?
View SolutionWhich of the following are true for an acid- base titration?
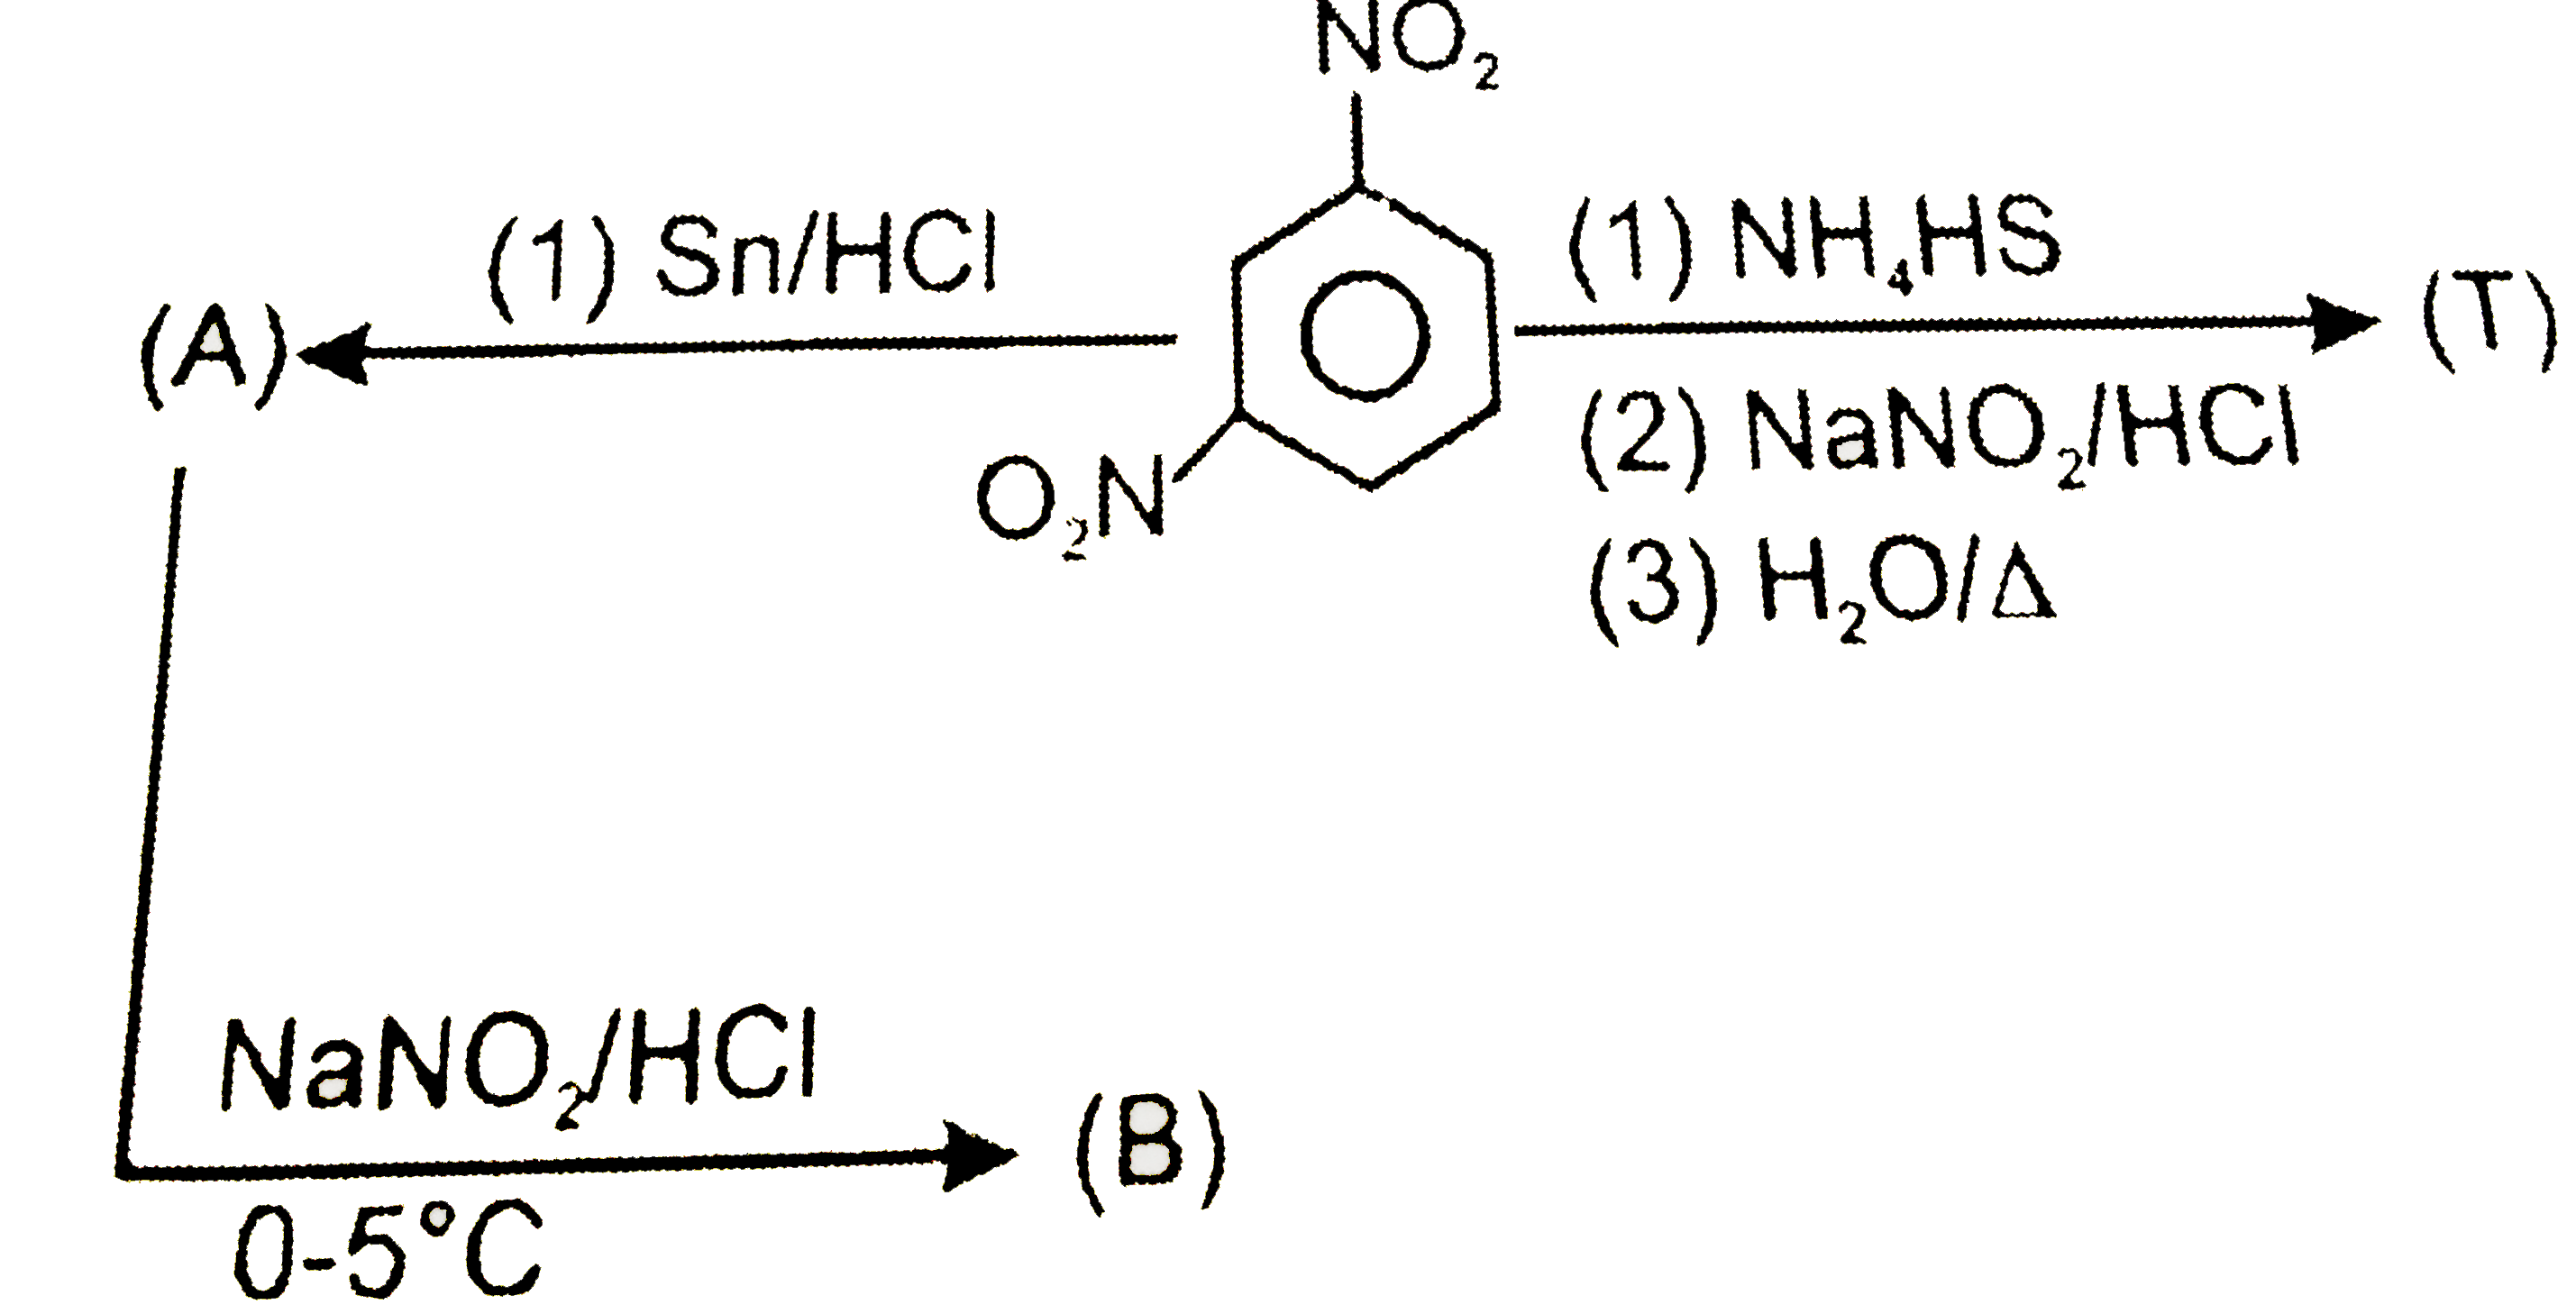
View SolutionObserve the following reactions and answer the following questions

For product (T), The correct statement is :
View Solution
