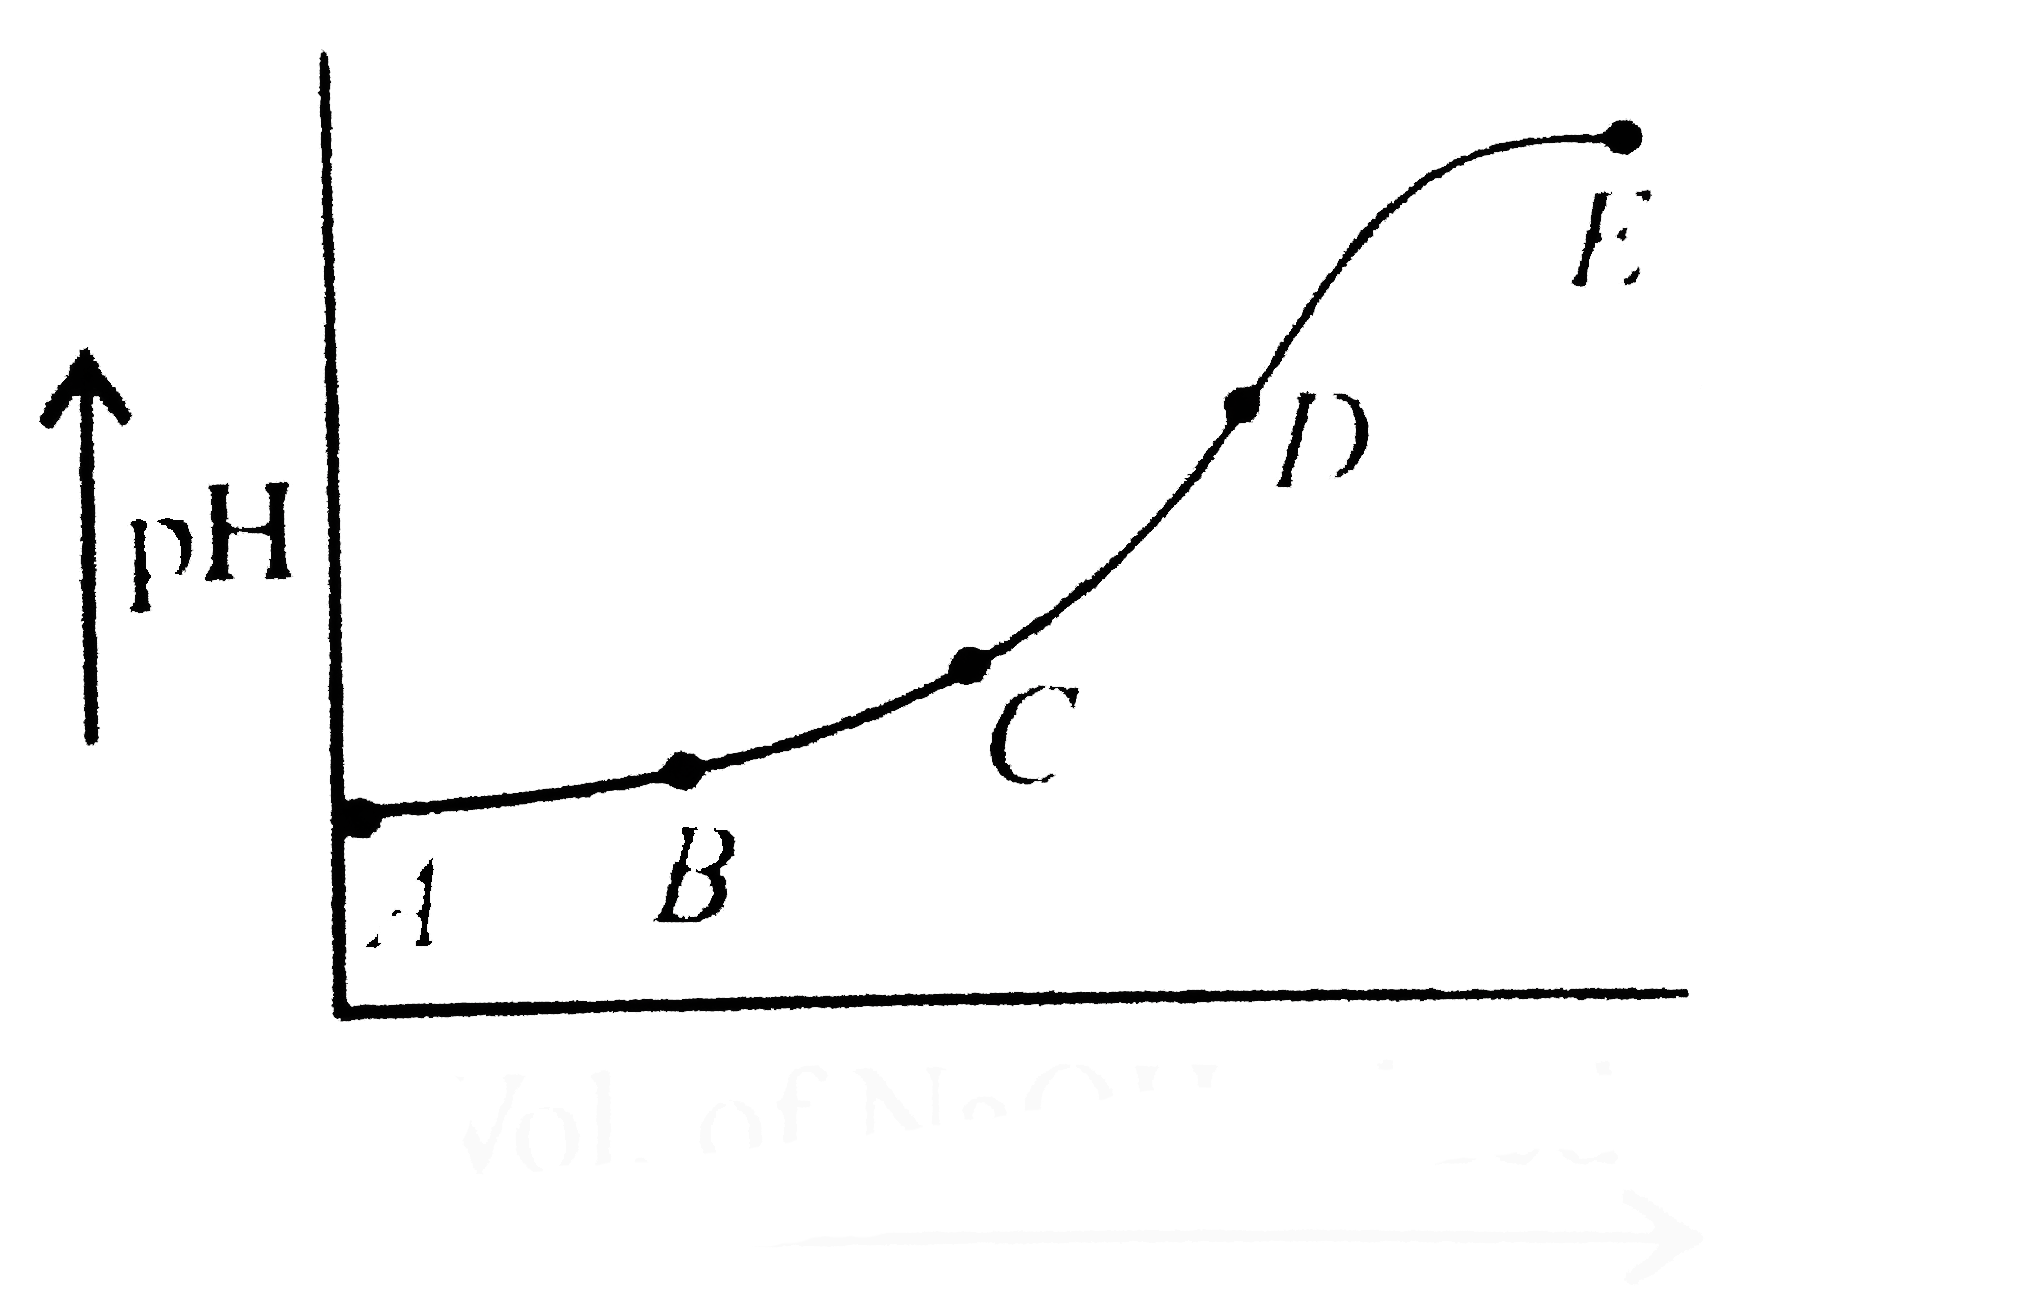
Which one is the correct graph (fig.) for the corresponding acid base titration?
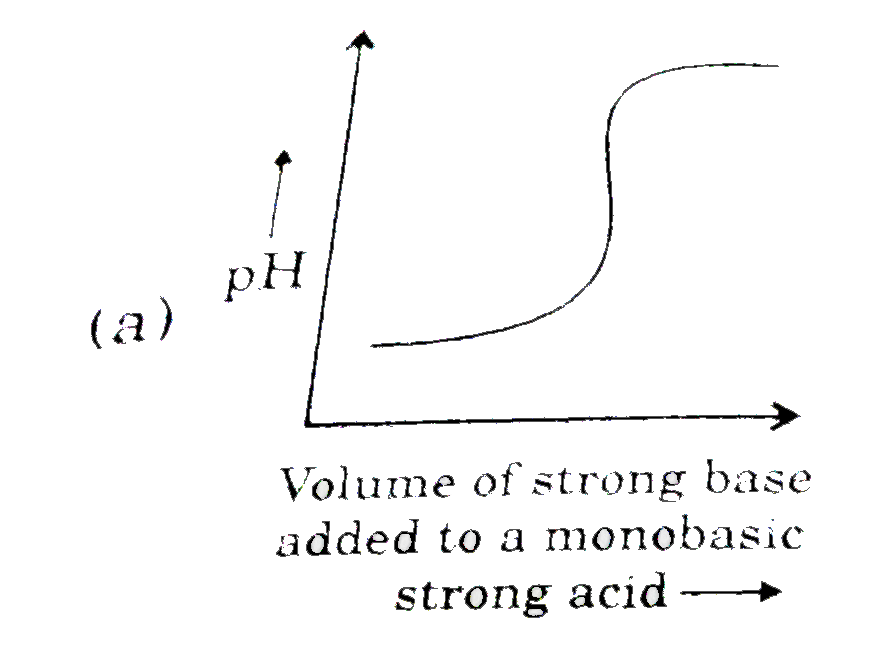
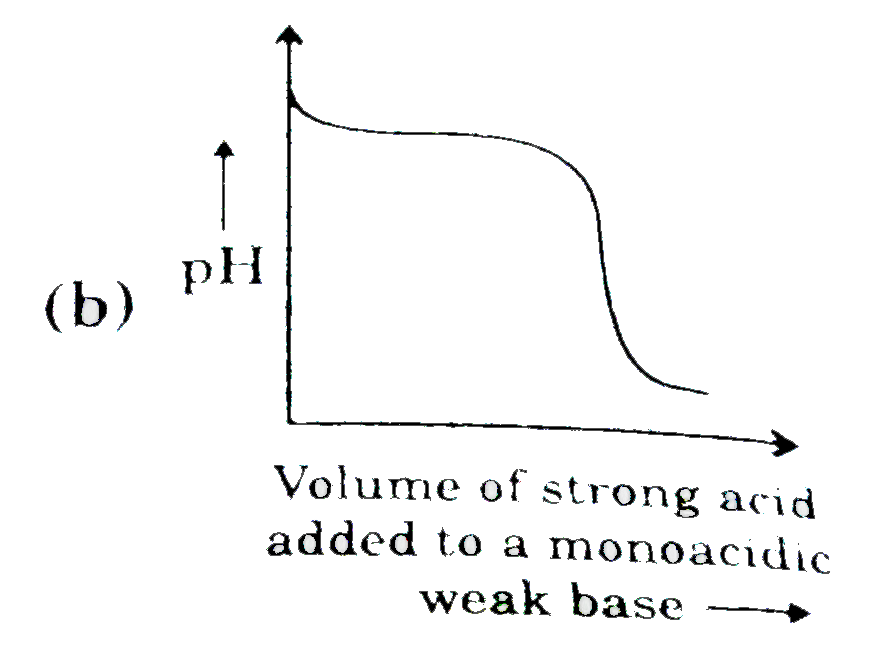
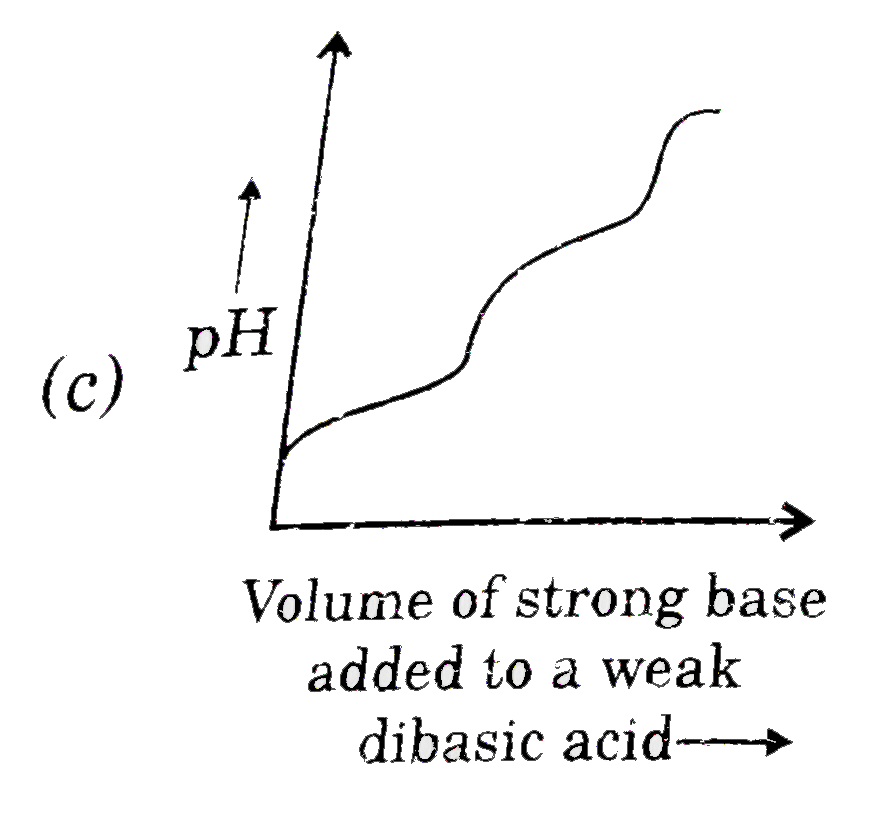
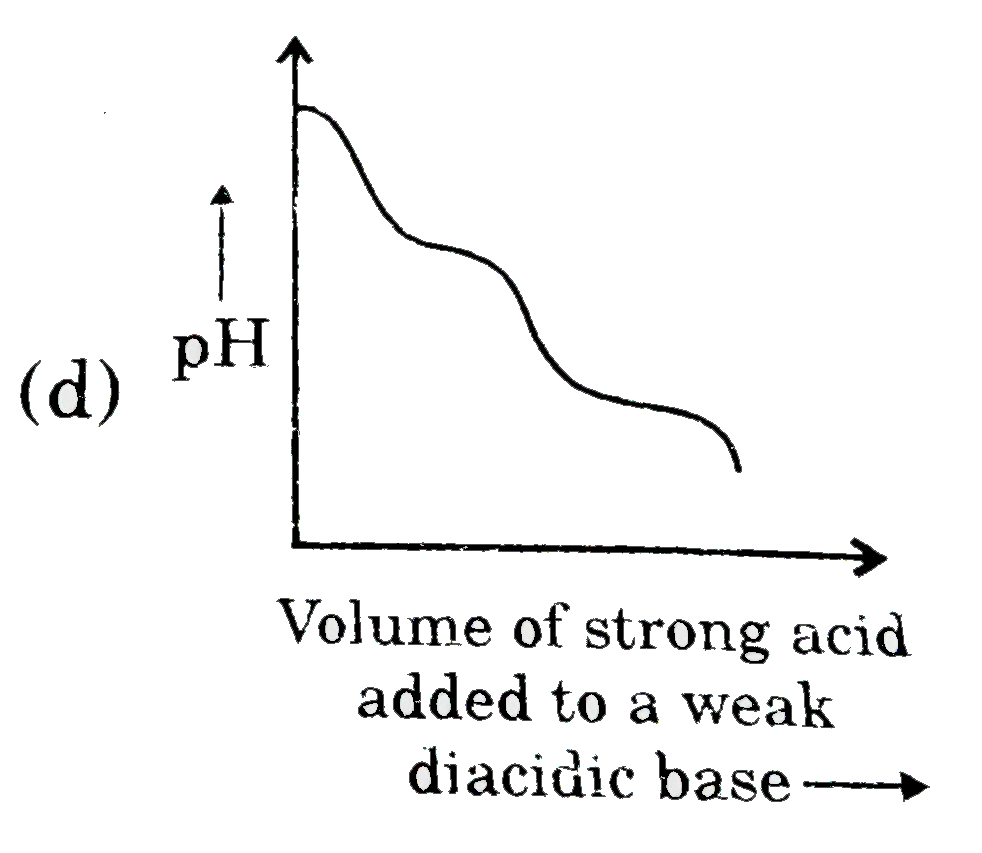
The correct Answer is:A, B, C, D
Topper's Solved these Questions
- BOOK - GRB PUBLICATIONCHAPTER - GRAPHICAL INTERPRETATIONEXERCISE - Comprehension 11videos
GRAPHICAL INTERPRETATION
- BOOK - GRB PUBLICATIONCHAPTER - GRAPHICAL INTERPRETATIONEXERCISE - Comprehension49videos
GRAPHICAL INTERPRETATION
- BOOK - GRB PUBLICATIONCHAPTER - GRAPHICAL INTERPRETATIONEXERCISE - Electrochemistry9videos
GRAPHICAL INTERPRETATION
- BOOK - GRB PUBLICATIONCHAPTER - F-BLOCK ELEMENTSEXERCISE - Subjective type7videos
F-BLOCK ELEMENTS
- BOOK - GRB PUBLICATIONCHAPTER - HYDROCARBON (ALIPHATIC)EXERCISE - Previous years jee questions28videos
HYDROCARBON (ALIPHATIC)
Similar Questions
Knowledge Check
- Question 1 - Select One or More
Which of the following are true for an acid- base titration?
AIndicators catalyse the acid-base reactions by relasing or accepting H⊕ ions.BIndicators do not significantly affect the pH of the solution to which they are addedCAcid-base reactions do not occur in the absence of indicatorsDIndicators have different colours in dissociated and undissociated forms. - Question 2 - Select One
Conductance measurements and be used to detect the end point of acid-base titrations. Which of the following plots correctly represents the end point of the titration of strong acid and a strong base?
A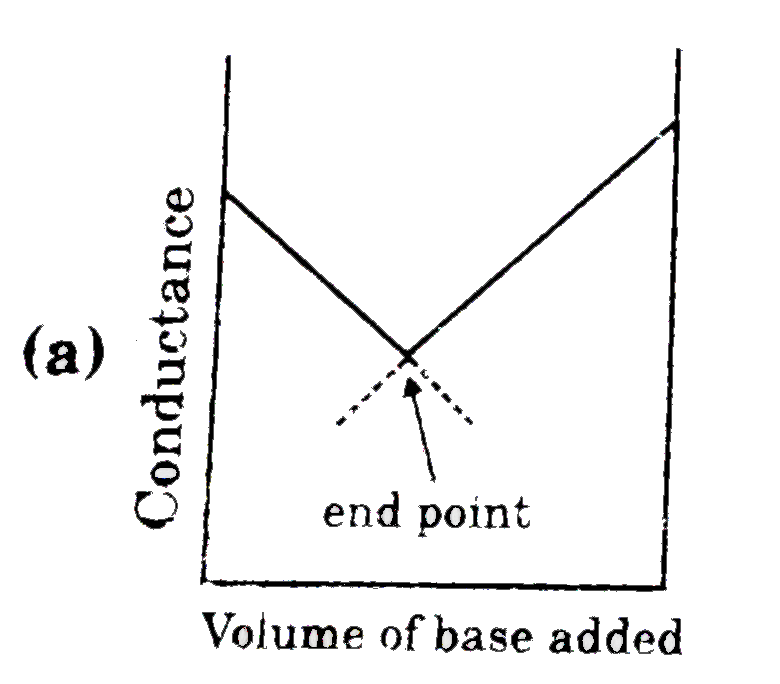 B
B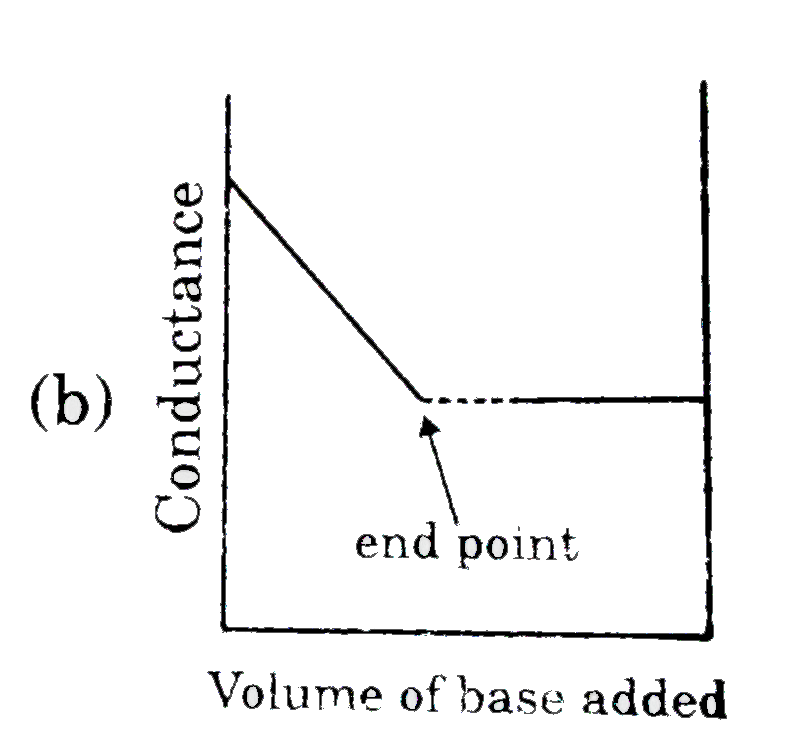 C
C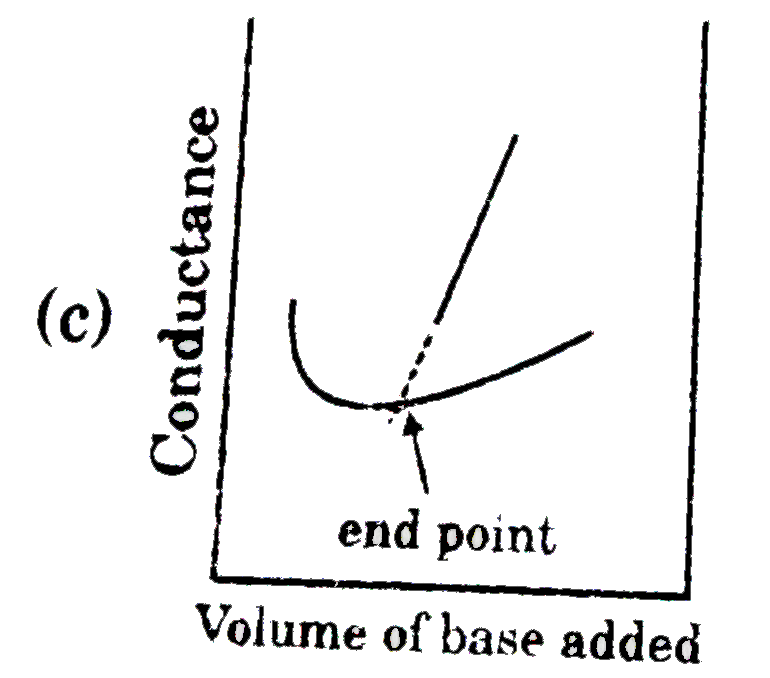 D
D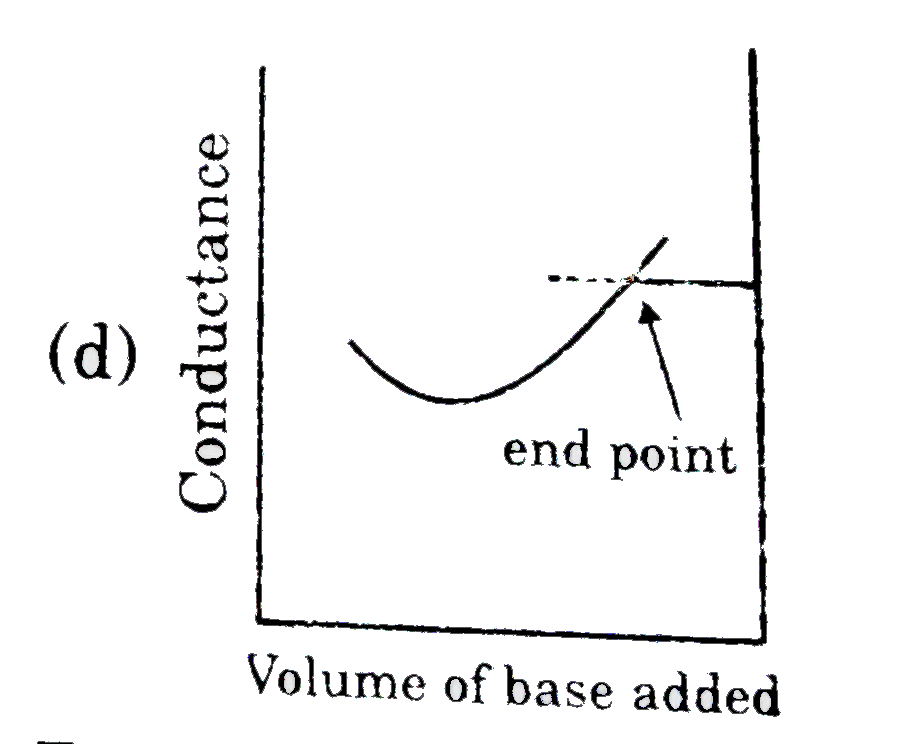
Which of the following is/are true for an acid- base titration?
View SolutionAn acid-base titration consists of the controlled addition of a dissolved base to a dissolved acid (or the reverse). Acid and base react rapidly to neutralize each other. At the equivalence point, equivalents of reacting substances are equal. The pH during a titration changes every time with a drop of titrant added, but the rate of this change varies enormously. A titration curve, graph of pH as a function of the volume of titrant, displays in detail how the pH changes over the course of an acid base titration. Significantly. the pH changes most rapidly near the equivalence point. The exact shape of a titration curve depends on the KaandKb of acid and base
The suitable indicator for this titration will be:View SolutionAn acid-base titration consists of the controlled addition of a dissolved base to a dissolved acid (or the reverse). Acid and base react rapidly to neutralize each other. At the equivalence point, equivalents of reacting substances are equal. The pH during a titration changes every time with a drop of titrant added, but the rate of this change varies enormously. A titration curve, graph of pH as a function of the volume of titrant, displays in detail how the pH changes over the course of an acid base titration. Significantly. the pH changes most rapidly near the equivalence point. The exact shape of a titration curve depends on the KaandKb of acid and base
The pH at equivalence point is:View Solutionquestion based on redox titration,acid base titration
View SolutionConductance measurements and be used to detect the end point of acid-base titrations. Which of the following plots correctly represents the end point of the titration of strong acid and a strong base?
View SolutionThe following curve shows the change of pH during the course of titration of weak acid HA with a strong base. At which point in the titration curve is the concentration of acid equal to that of its conjugate base.
 View Solution

