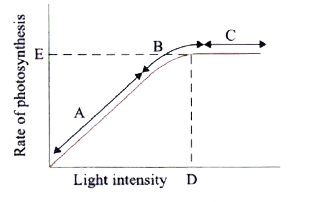
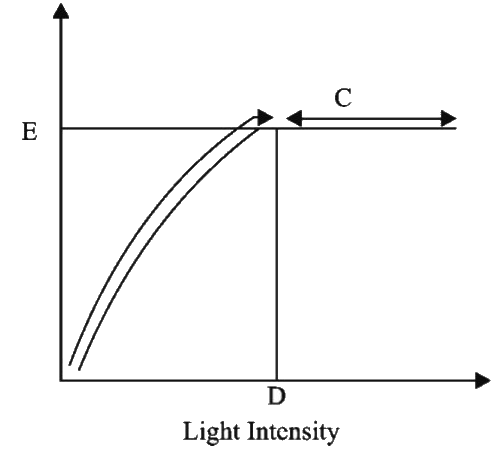
Figure shows the effect of light on the rate of photosynthesis. Based on the graph, answer the following questions:
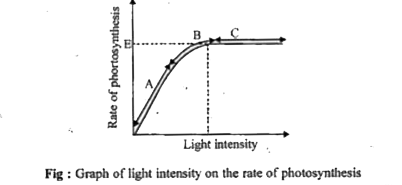
What do 'C' and 'D' represent on the curve?
Region .C. represents the constant rate of photosynthesis. If we further increase the intensity of light then there will be no effect on the rate of photosynthesis. Point .D. represents the intensity of light beyond which the light does not remain the limiting factor. The rate of photosynthesis is maximum at this light intensily. This .D. point indicates that at this intensity of light other factors may become limiting.
Similar Questions
The figure shows the effect of light on the rate of photosynthesis. Based on the graph, answer the following questions :
What do region C and D represent on the curve ?
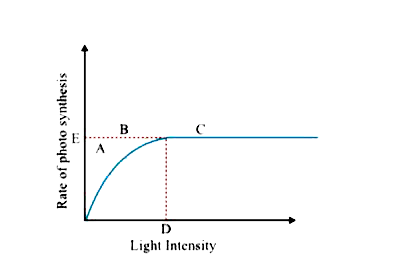
View SolutionFigure shows the effect of light on the rate of photosynthesis.
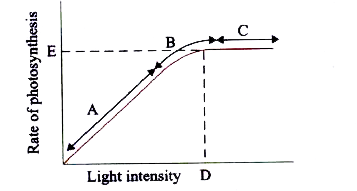
Based on the graph, answer the following questions.
At which point/s (A, B, or C) in the curve is light a limiting factor?
View SolutionFigure shows, the effect of light on the rate of photosynthesis Based on the graph, answer the following questions.
a) At which points (A,B or C) in the curve is light a limiting factor?
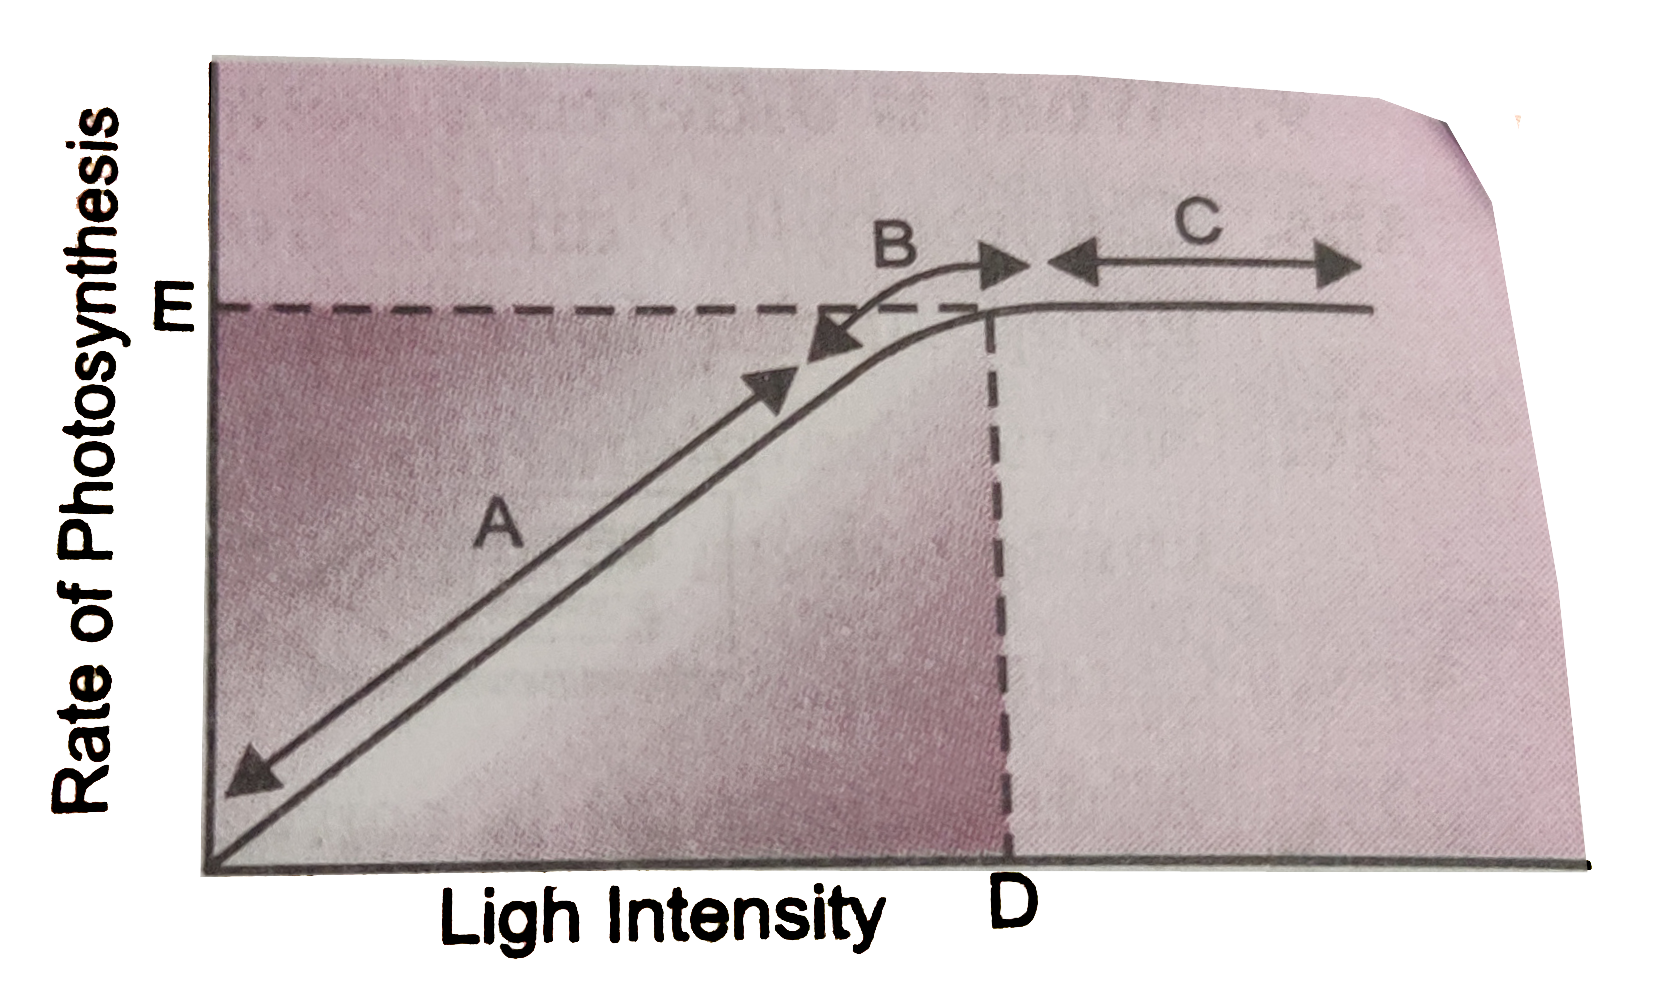
b) What could be the limiting factor/s in region A?
c) What do C and D represent on the curve?
View SolutionFigure shows the effect of light on the rate of photosynthesis.
Based on the graph, answer the following questions.
What would be the limiting factors in region A?
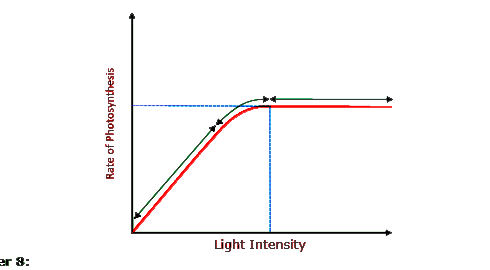
View SolutionFigure 13.10 shows the effect of light on the rate of photosynthesis. Based on the graph, answer the following questions:
(a) At which point/s (A, B or C) in the curve is light a limiting factor?
(b) What could be the limiting factor/s in region A?
(c) What do C and D represent on the curve?
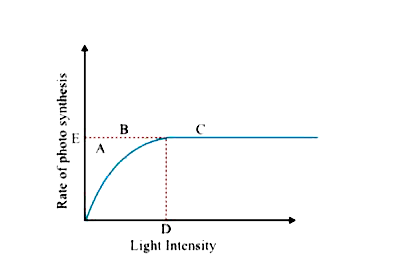
View SolutionThe figure shows the effect of light on the rate of photosynthesis. Based on the graph, answer the following questions :
What could be the limiting factor(s) in region A ?
View SolutionBased on the below diagram, answer the following question.
What do labels C and D denote?
View SolutionFigure given below shows the effect of light on the role of photosynthesis. Based on graph
What could be the limiting factor/factors in region A?
View SolutionFigure given below shows the effect of light on the role of photosynthesis. Based on graph
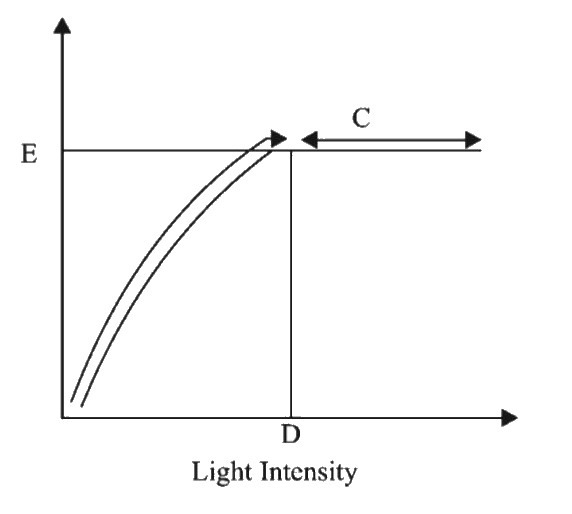
At which point/points (A,B or C) in the curve light is a limiting fac- tor?
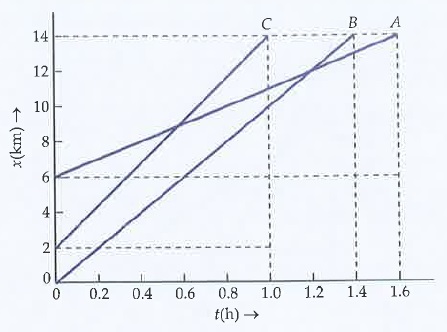
View SolutionFigure shows the position-time graphs of three car A, B and C. On the basis of the graphs, answer the following questions : What is the relative velocity of car B with respect to car C ?
View Solution
