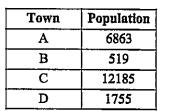
The population of four towns A, B, C and D as on 2001 are as follows:

What is the most appropriate diagrams to present the above data?
Pie diagram
Bar chart
Cubic chart
Histogram
The correct Answer is:B
Step by step video & image solution for The population of four towns A, B, C and D as on 2001 are as follows: What is the most appropriate diagrams to present the above data? by Maths experts to help you in doubts & scoring excellent marks in Class 14 exams.
Updated on:21/07/2023Topper's Solved these Questions
Similar Questions
Knowledge Check
The populations of four towns A, B, C and D as on 2001 are as follows:

What is the most appropriate diagram to present the above data?Apie chartBBar chartCHistogramDLine graphThe population of four towns A,B,C and D as on 2011 are as follows:what is the most appropriate diagram to present the above data?
 APie chartBBar chartCHistogramDLine graph
The present population of a town is 26010. It increases annually at the rate of 2%. What was the population of town 2 years ago ?
A25000B25100C25200D25500
Present the following data in the form of horizontal bar diagram :

View SolutionThe population of a town is increasing at the rate of 5% per annum. What will be the population of the town on this basis after two years, if the present population is 16000?
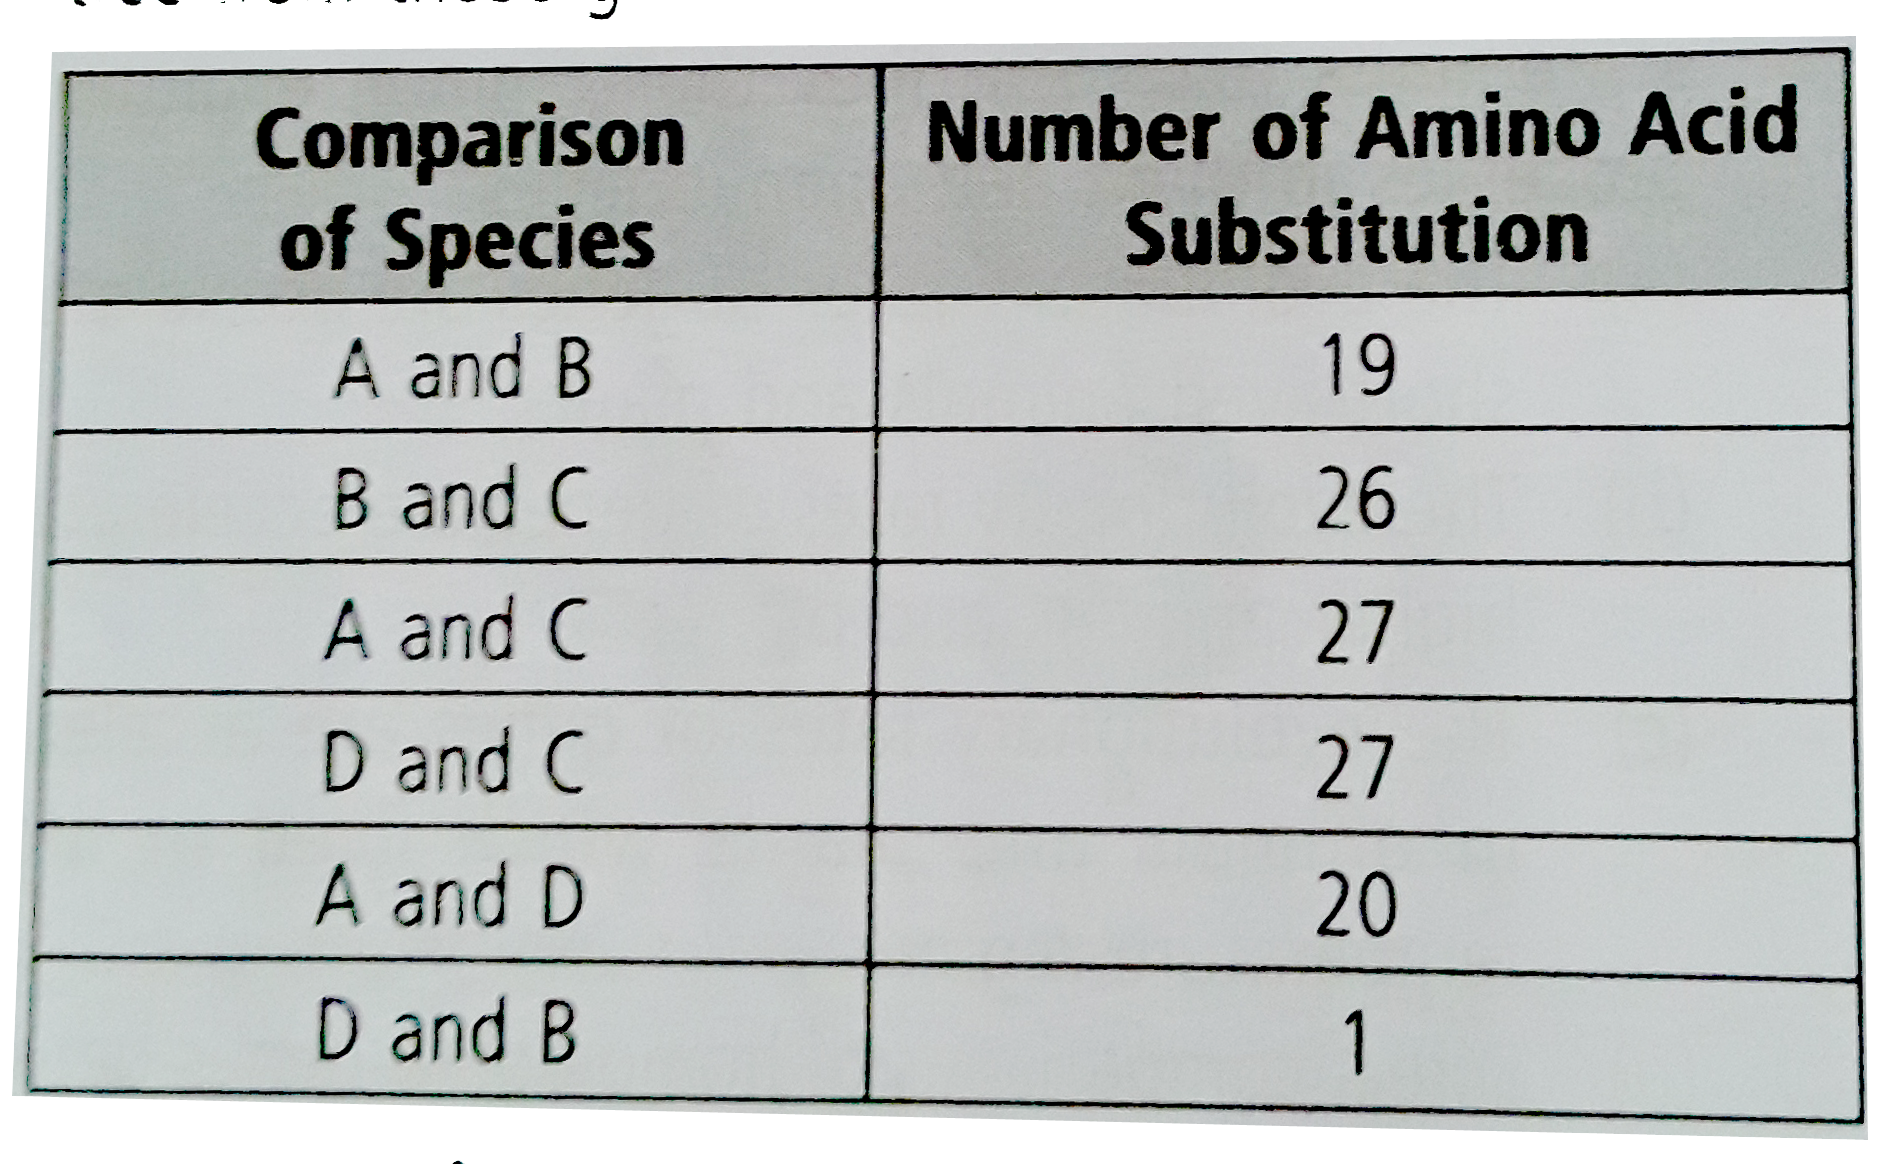
View SolutionFollowing table shows data on amino acid substitution in the α chain of haemoglobin in four different mammalian species A,B,C and D on the basis of the data shown in the table. Choose the most appropriate evolutionary tree from those given below.

View SolutionThe present population of a town is 26010. It increases annually at the rate of 2%. What was the population of town two years ago ?
View SolutionThe present population of a town is 26010. It increases annually at the rate of 2%. What was the population of town 2 years ago ?
View Solution

