A survey of 300 people found that 30 of them play cricket. In a pie chart, what would be the sector angle of this group ?
20∘
36∘
30∘
10∘
To find the sector angle of the group that plays cricket in a pie chart, we can follow these steps:
Step 1: Understand the total angle in a pie chart
A pie chart represents a whole (100%) which corresponds to an angle of 360 degrees.
Step 2: Determine the total number of people surveyed
In this case, the total number of people surveyed is 300.
Step 3: Identify the number of people who play cricket
According to the survey, 30 people play cricket.
Step 4: Calculate the angle per person
To find out how many degrees each person represents in the pie chart, we divide the total angle of the pie chart (360 degrees) by the total number of people (300):
Angle per person=360 degrees300 people=1.2 degrees per person
Step 5: Calculate the sector angle for the cricket players
Now, to find the sector angle for the group that plays cricket, we multiply the angle per person by the number of people who play cricket:
Sector angle for cricket players=30 people×1.2 degrees per person=36 degrees
Conclusion
Therefore, the sector angle of the group that plays cricket in the pie chart is 36 degrees.
---
A pie chart represents a whole (100%) which corresponds to an angle of 360 degrees.
In this case, the total number of people surveyed is 300.
According to the survey, 30 people play cricket.
To find out how many degrees each person represents in the pie chart, we divide the total angle of the pie chart (360 degrees) by the total number of people (300):
Angle per person=360 degrees300 people=1.2 degrees per person
Now, to find the sector angle for the group that plays cricket, we multiply the angle per person by the number of people who play cricket:
Sector angle for cricket players=30 people×1.2 degrees per person=36 degrees
Therefore, the sector angle of the group that plays cricket in the pie chart is 36 degrees.
Similar Questions
In a survey of 450 people, it was found that 110 play cricket, 160 play tennis and 70 play both cricket as well as tennis. How many play neither cricket nor tennis?
View SolutionThe given pie chart depicts the expenditure incured in crores towards each sport.
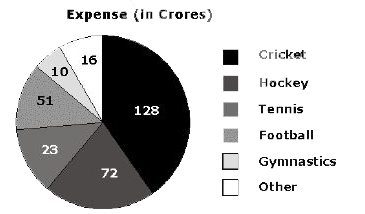
In the given pie chart what will be the central angle of the sector representing football?
View Solution
Knowledge Check
A survey of 300 people found that 30 of them play cricket. In a piechart, what would be the sector angle of this group?
A20∘B36∘C30∘D10∘The table shows the production of different types of cars (in thousands).
 In the data related to the production of type D cars in represented by a pie chart, then the central angle of the sector representing production of cars in 2015 will be:
यदि D प्रकार की कारों से संबंधित आंकड़ों को एक पाई-चार्ट में प्रस्तुत किया जाए, तो 2015 में कारों के उत्पादन को दर्शाने वाले खंड का केंद्रीय कोण होगा :A72∘B63∘C81∘D99∘The table shows the production of different types of cars (in thousands).
यह तालिका एक कंपनी द्वारा 5 वर्षों में अलग-अलग कारों के उत्पादन (हज़ार में ) को दर्शाती है | If the data related to the production of type D cars is represented by a pie chart, then the central angle of the sector representing the production of
cars in 2013 will be:
यदि D प्रकार की कारों के उत्पादन से संबंधित आंकड़ों को एक पाई-चार्ट में प्रस्तुत किया जाए, तो 2013 में कारों के उत्पादन को दर्शाने वाले खंड का केंद्रीय कोण होगा :A84∘B75∘C60∘D77∘
The Pie-chart shows the result of a survey among 119060 people concerning the use of tobacco. Study the Pie-chart and answer the questions.
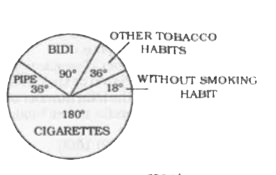
The number of people smoking Cigarettes is :
View SolutionThe Pie-chart shows the result of a survey among 119060 people concerning the use of tobacco. Study the Pie-chart and answer the questions.
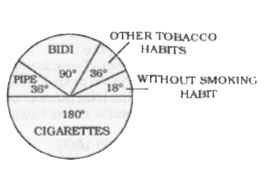
The number of people preferring Bidi is :
View SolutionThe table shows the production of different types of cars (in thousands).
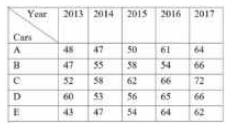
If the data related to the production of type D cars is represented by a pie chart, then the central angle of the sector representing the production of cars in 2016 will be:
View SolutionThe table shows the production of different types of cars (in thousands).
यह तालिका एक कंपनी द्वारा अलग-अलग कारों के उत्पादन (हज़ार में ) को दर्शाती है |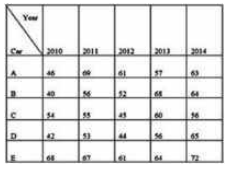 If the data related to the production of type C cars is represented by a pie-chart, then the central angle of the sector representing production of cars in 2012 will be:
यदि C प्रकार की कारों के उत्पादन से संबंधित आंकड़ों को एक पाई-चार्ट में प्रस्तुत किया जाए, तो 2012 में कारों के उत्पादन को दर्शाने वाले खंड का केंद्रीय कोण होगा :
View SolutionThe table shows the production of different types of cars (in thousands).

If the data related to the production of type D cars is represented by a pie chart, then the central angle of the sector representing the production of cars in 2016 will be:
View Solution
