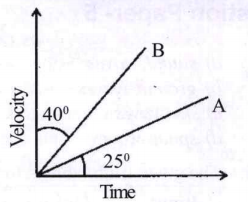
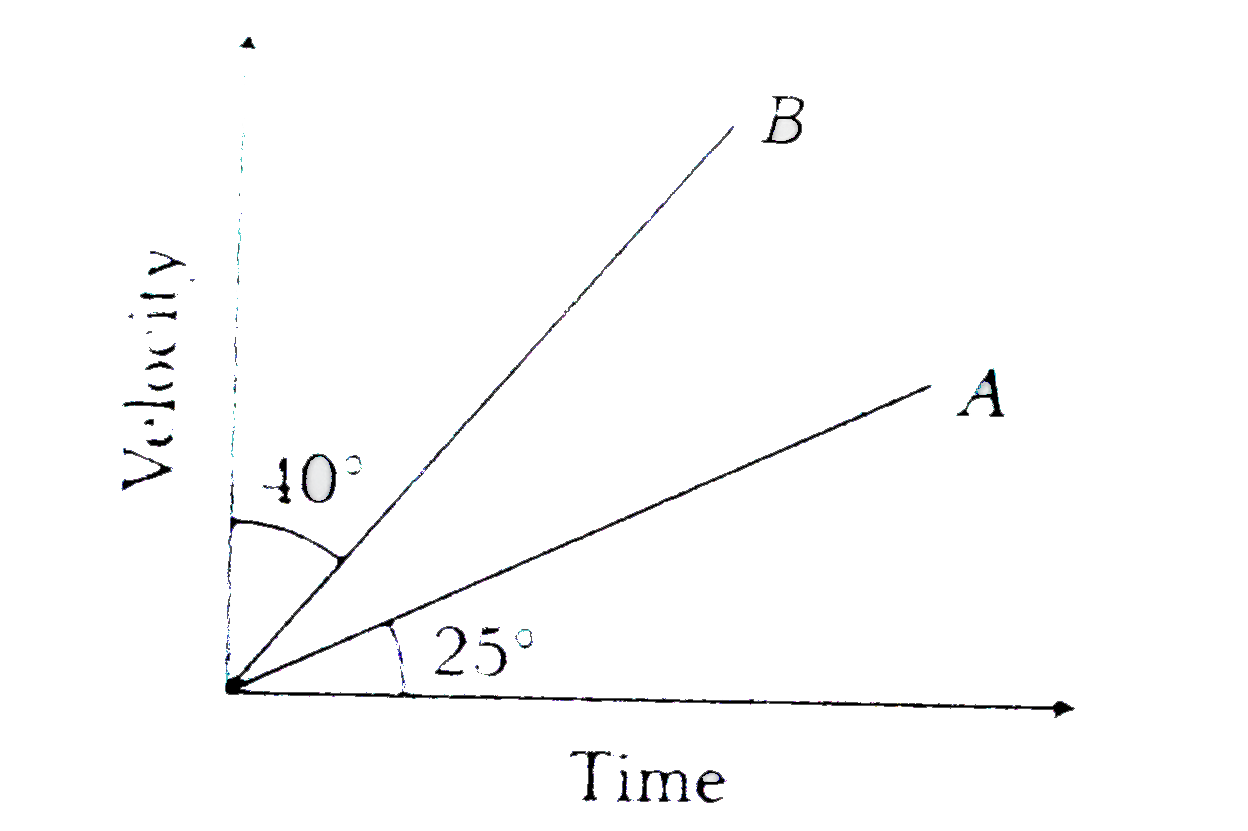
The velocity-time graph for two bodies Aand B are shown in figure. Then, the acceleration of A and B are in the ratio:
 Solution in Tamil
sin25∘→sin50∘
tan25∘→tan40∘
cos25∘→cos50∘
tan25∘→tan50∘
Step by step video & image solution for The velocity-time graph for two bodies Aand B are shown in figure. Then, the acceleration of A and B are in the ratio: by Physics experts to help you in doubts & scoring excellent marks in Class 12 exams.
Updated on:21/07/2023Topper's Solved these Questions
Similar Questions
The p-type semiconductor is
View SolutionA radioactive source of halflife 2 h emits radiation of intensity which is 64 times the permissible safe level. The minimum time in hours after which it would be possible to work safely with the source is:
View SolutionA body starts from rest at time t = 0 , the acceleration time graph is shown in the figure . The maximum velocity attained by the body will be
View SolutionThe velocity - time graph of two bodies A and B is shown in figure. Choose correct statement.
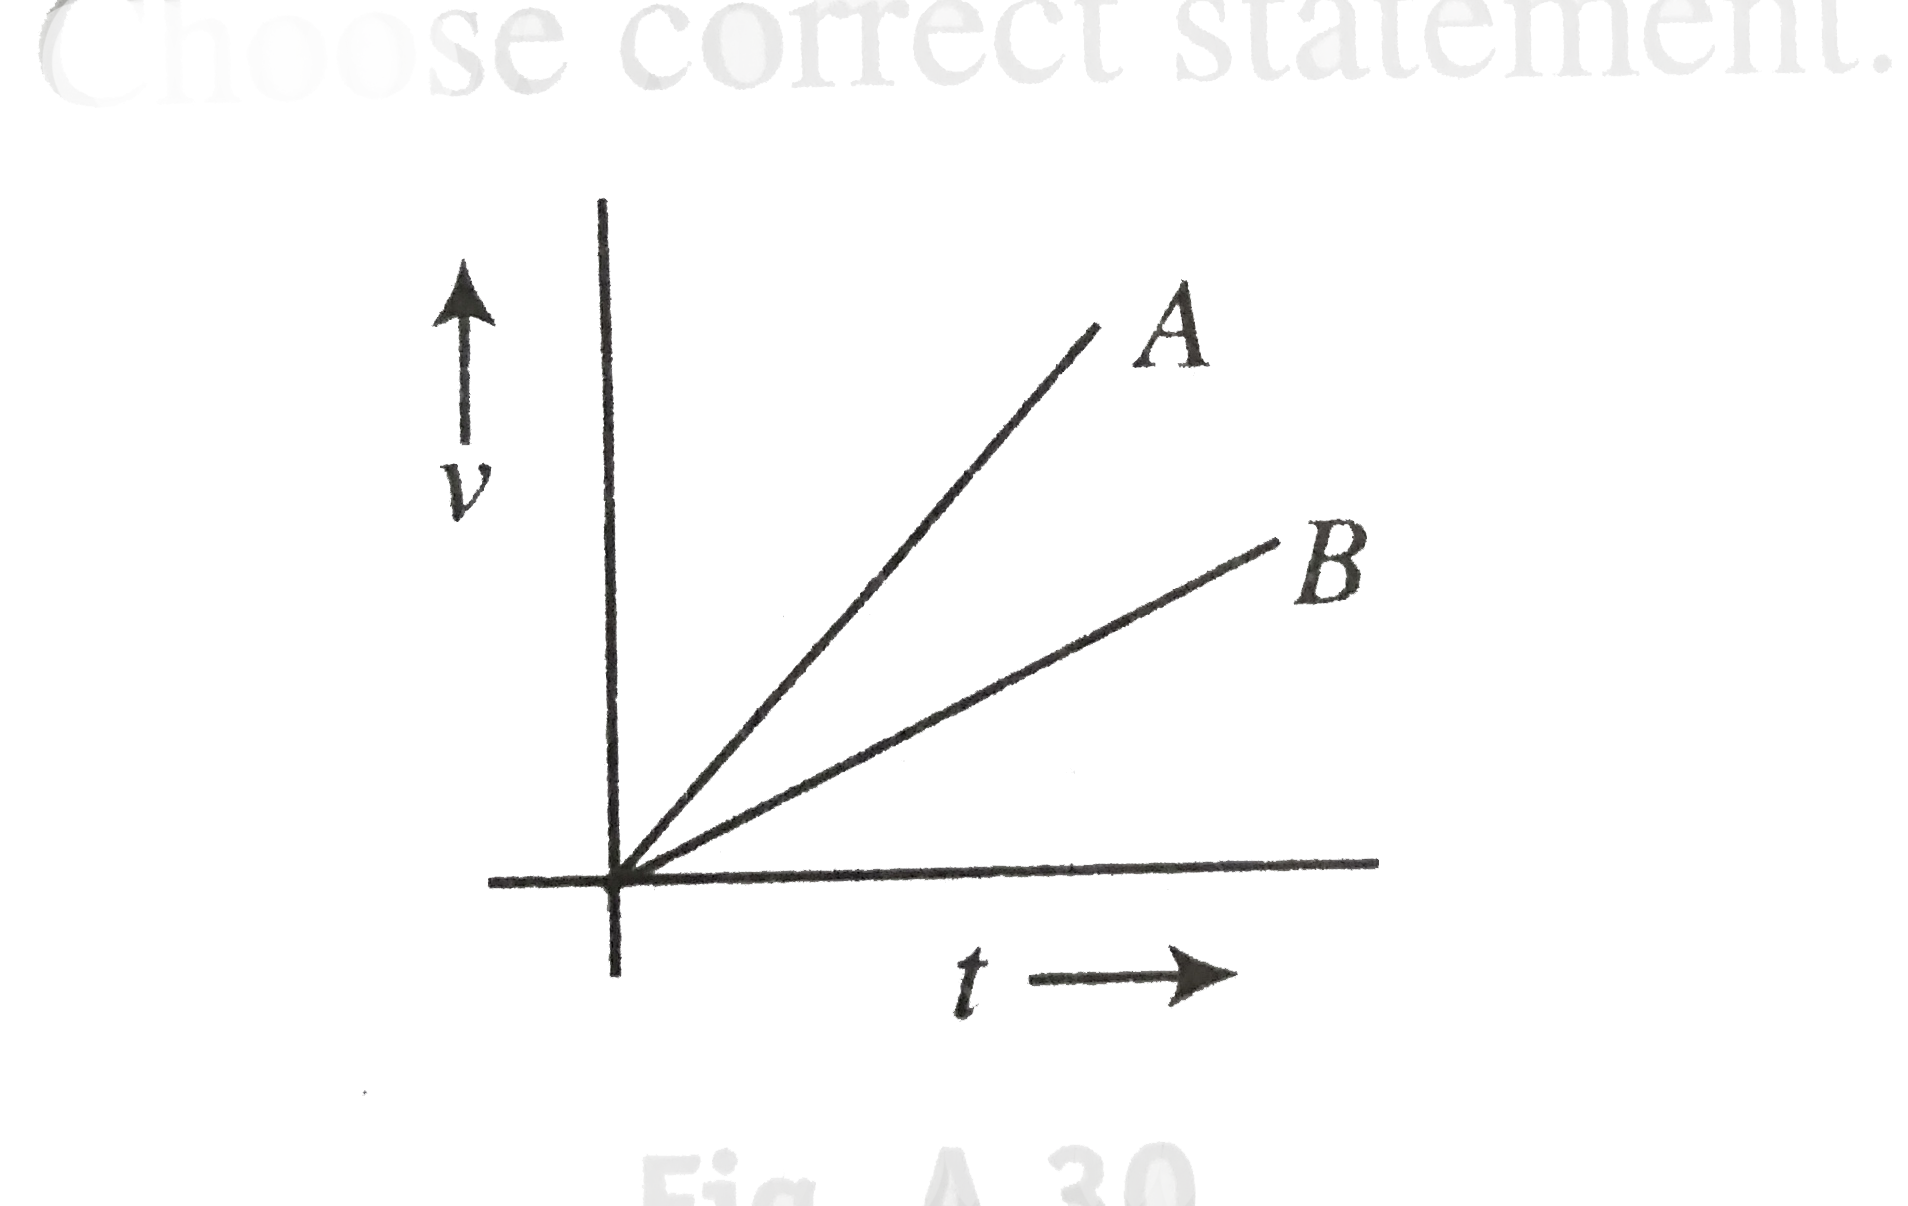
View Solution(a) Look at the velocity time graph of two bodies A and B , Figure. which body starts from rest and which body has some initial velocity ? (b) From Figure, which body is having greater acceleration ?
View Solution(a) The velocity time graph of two bodies are shown in Figure. Slope of the graph for body A is positive. What does it signify ?
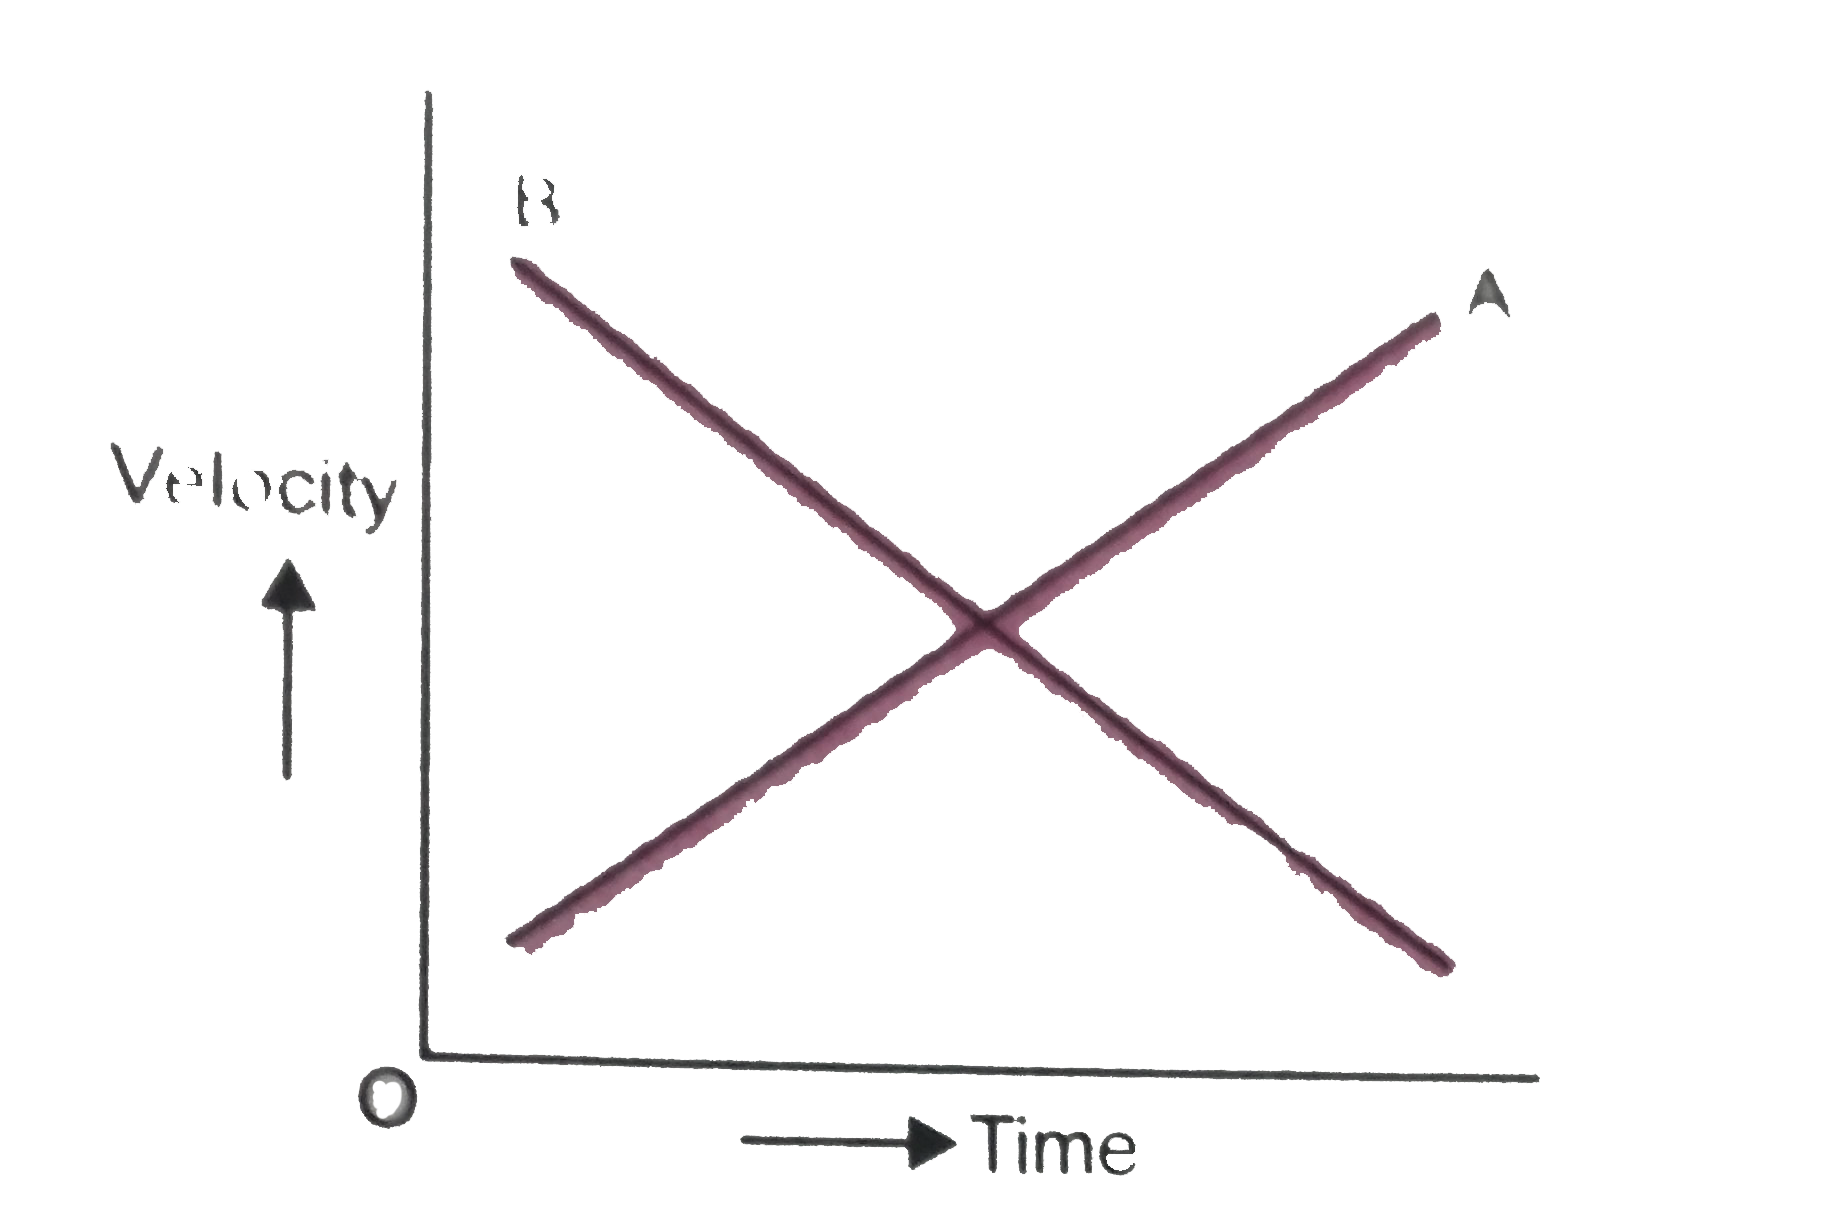
(b) The slope of velocity time graph of body B is negative. What does it represent ?
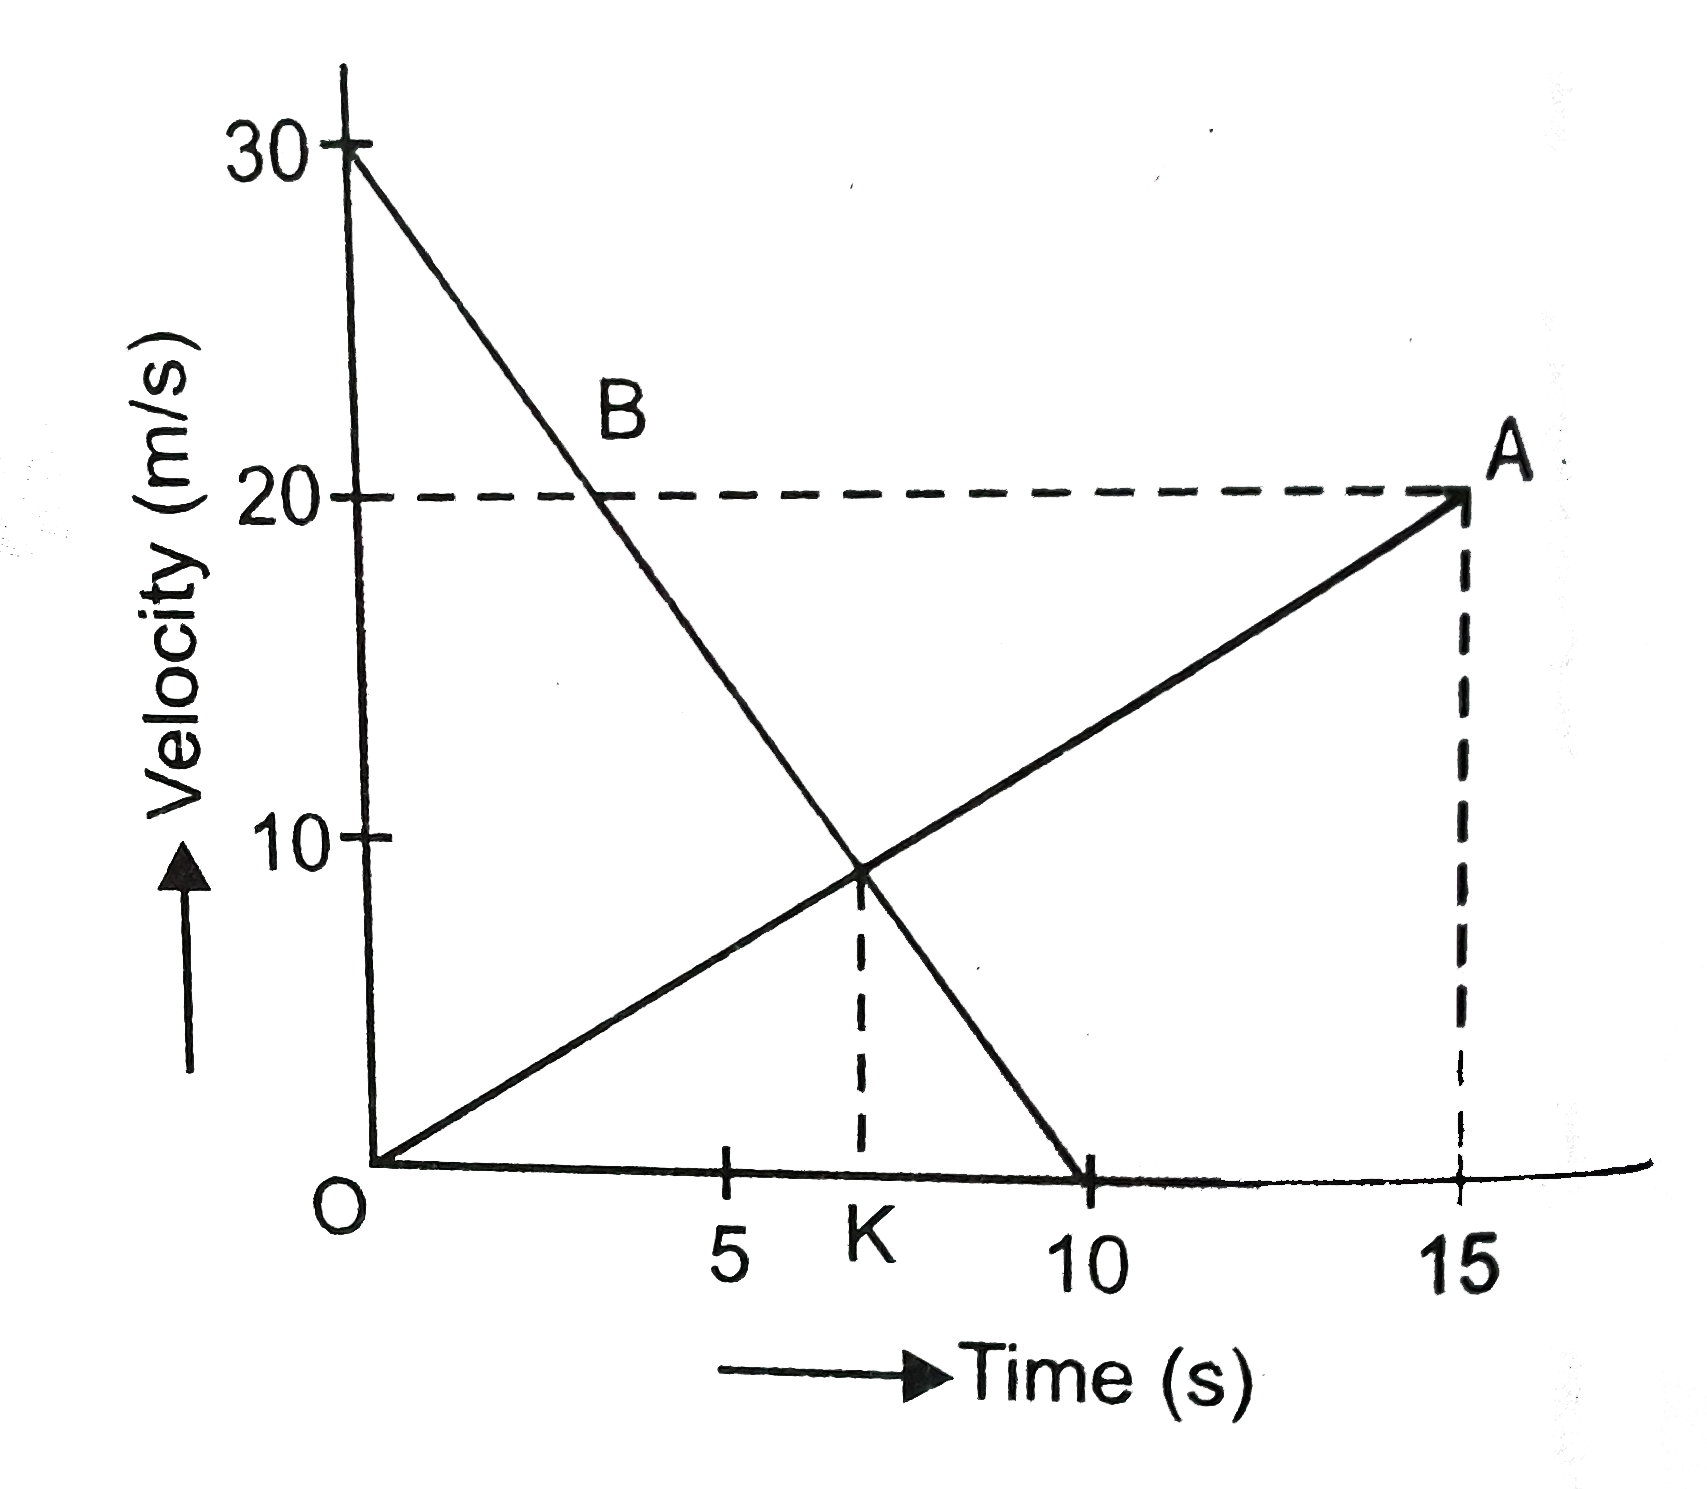
View SolutionThe velocity time graphs of two bodies A and B are shown in Figure. Observe these graphs carefully and answer the following questions :
(i) From the shape of graphs, what is nature of motion of A and B
(ii) What do you infer from the slopes of the graphs ?
(iii) What are the initial velocities of A and B ?
(iv) What is acceleration of A ?
(v) What is acceleration of B ?
(vi) What distance is travelled by B before coming to rest ?
(vii) At what time will the two bodies have equal velocity ?
View SolutionThe displacement-time graphs of two bodies A and B are OP and OQ respectively. If anglePOX is 60^(@) and angleQOX is 45^(@) the ratio of the velocity of A to that of B is
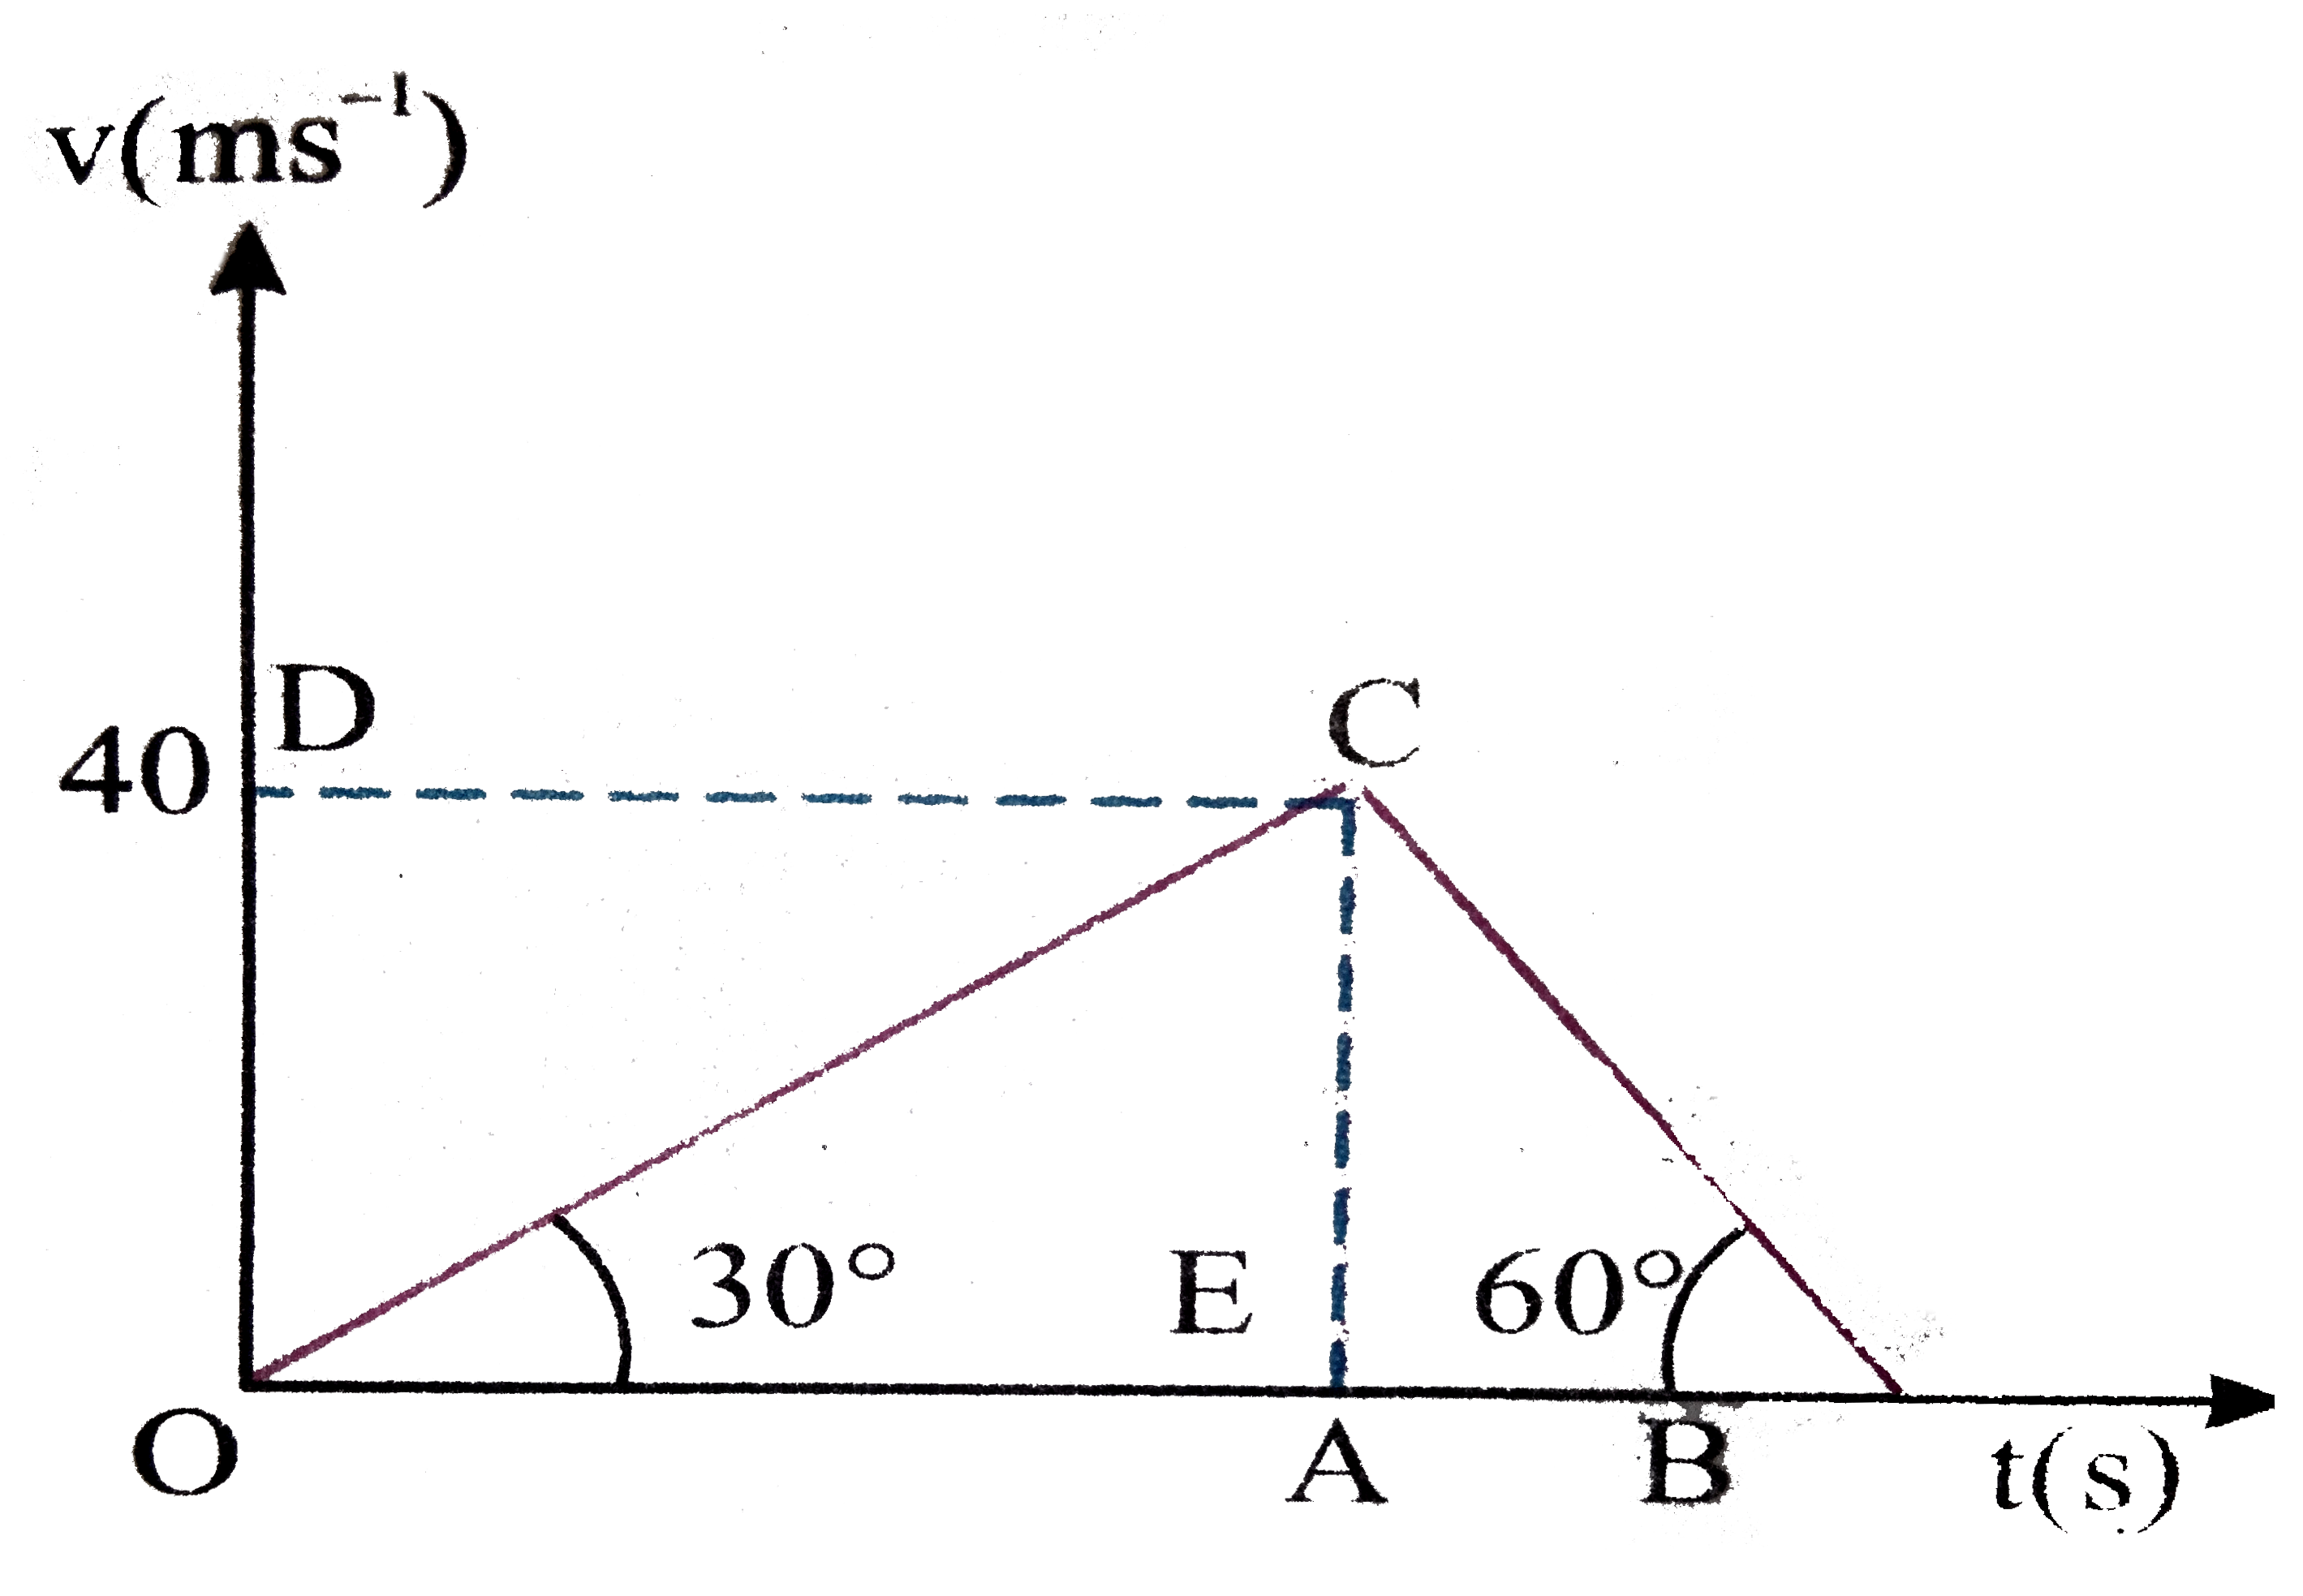
View SolutionThe velocity-time graph of a body is shown in figure. The ratio of magnitude of average acceleration during the intervals OA and AB is
View SolutionThe displacement time graphs of two bodies A and B are shown in figure. The ratio of velocity of A to velocity of B,vA/vB is:

View SolutionThe velocity - time graph for two bodies A and B are shown in figure. Then, the acceleration of A and B are in the ratio
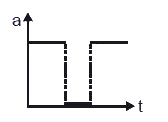
View SolutionThe graph in figure shows the velocity v versus time t for a body. Which of the graphs shown in figure represents the correesponding acceleration versus time graphs ?
View SolutionThe velocity - time graph for two bodies A and B are in the ratio
View SolutionThe velocity - time graph for two bodies A and B are in the ratio
View Solutionदो कण A और B के लिए वेग समय आरेख चित्र में प्रदर्शित किया गया है। तब A और B का त्वरण होगा
View Solutionकिसी वस्तु के लिये त्वरण-समय ग्राफ चित्र में दिखाया गया है। तो संगत वेग-समय ग्राफ होगा :
View Solution
