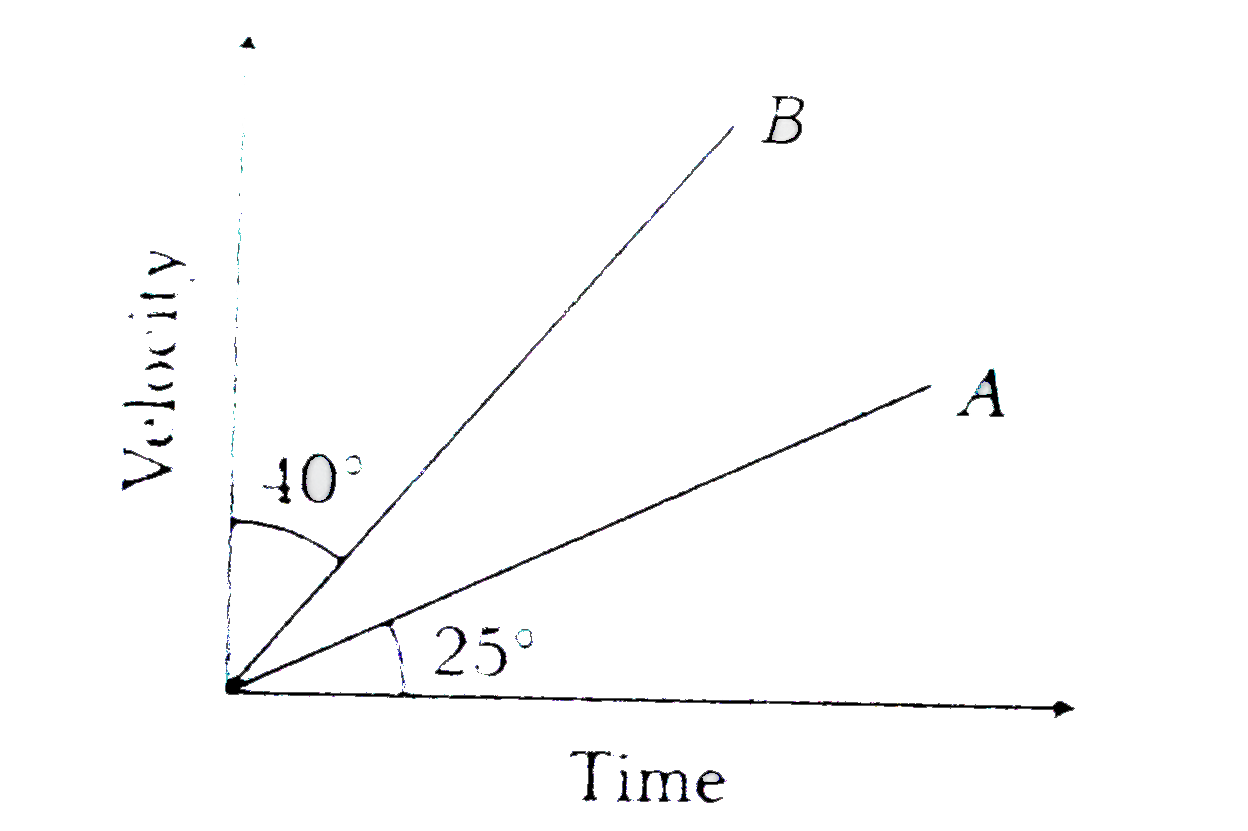
The velocity - time graph for two bodies A and B are shown in figure. Then, the acceleration of A and B are in the ratio
to
to
to
to
The correct Answer is:D
The slope of velocity-time graph gives acceleration,
i.e.,
Topper's Solved these Questions
- MOTION IN A PLANEBook:DC PANDEYChapter:MOTION IN A PLANEExercise:(B) Meical entrance special format questions (Mathch the columns)
Explore 6 Videos
- MOTIONBook:DC PANDEYChapter:MOTIONExercise:Medical entrances gallery
Explore 19 Videos
- PROJECTILE MOTIONBook:DC PANDEYChapter:PROJECTILE MOTIONExercise:Level - 2 Subjective
Explore 10 Videos
Similar Questions
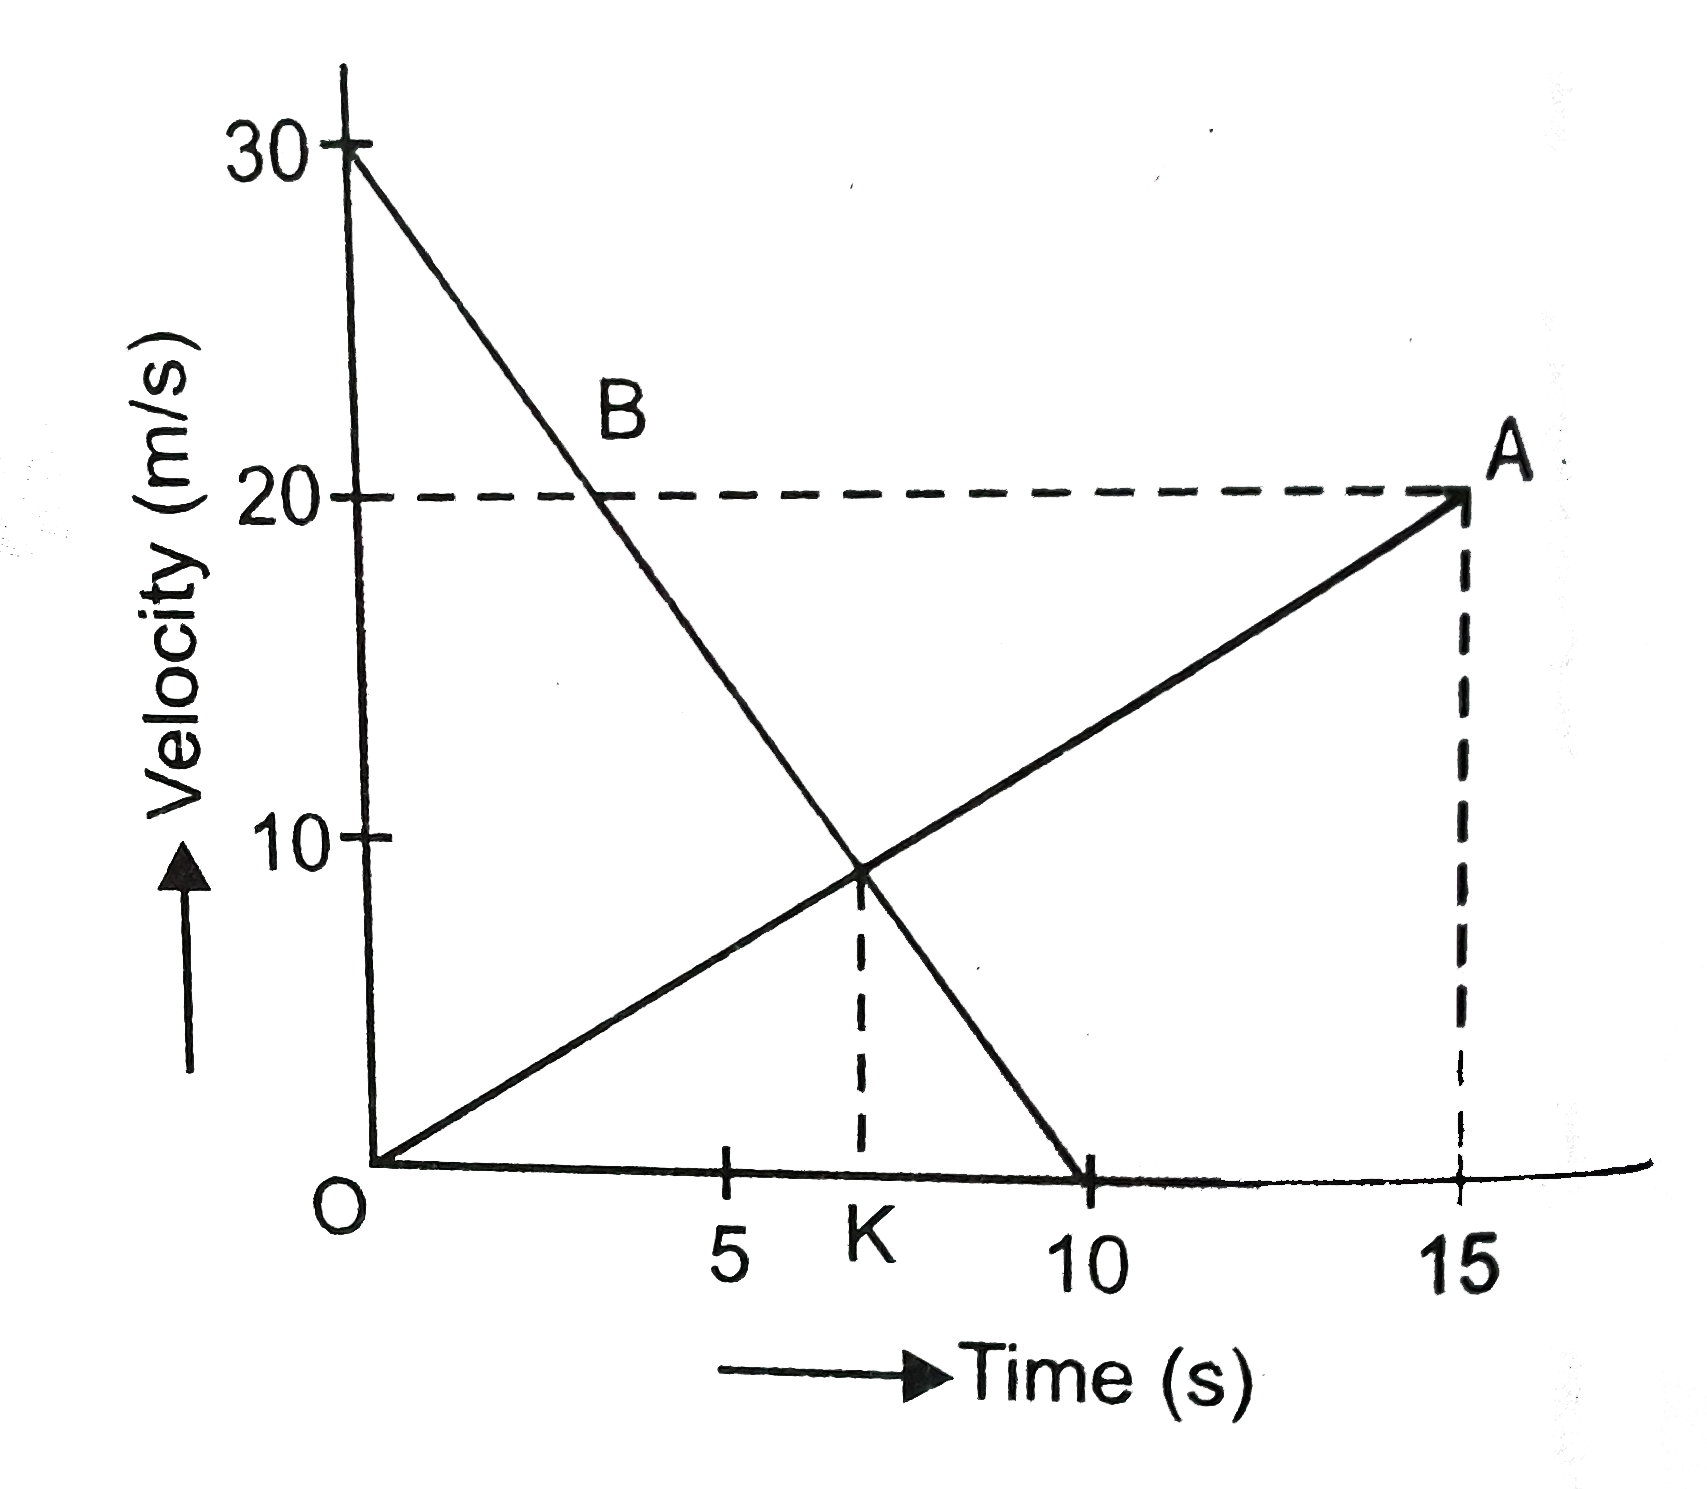
The velocity time graphs of two bodies A and B are shown in Figure. Observe these graphs carefully and answer the following questions :
(i) From the shape of graphs, what is nature of motion of A and B
(ii) What do you infer from the slopes of the graphs ?
(iii) What are the initial velocities of A and B ?
(iv) What is acceleration of A ?
(v) What is acceleration of B ?
(vi) What distance is travelled by B before coming to rest ?
(vii) At what time will the two bodies have equal velocity ?
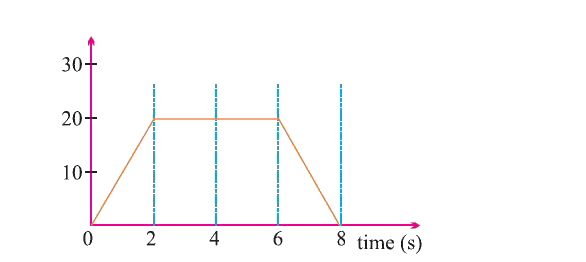
View SolutionThe velocity time graph for a particle is shown in figure. Draw acceleration time graph from it.
View Solution
Knowledge Check
The velocity - time graph of two bodies A and B is shown in figure. Choose correct statement.
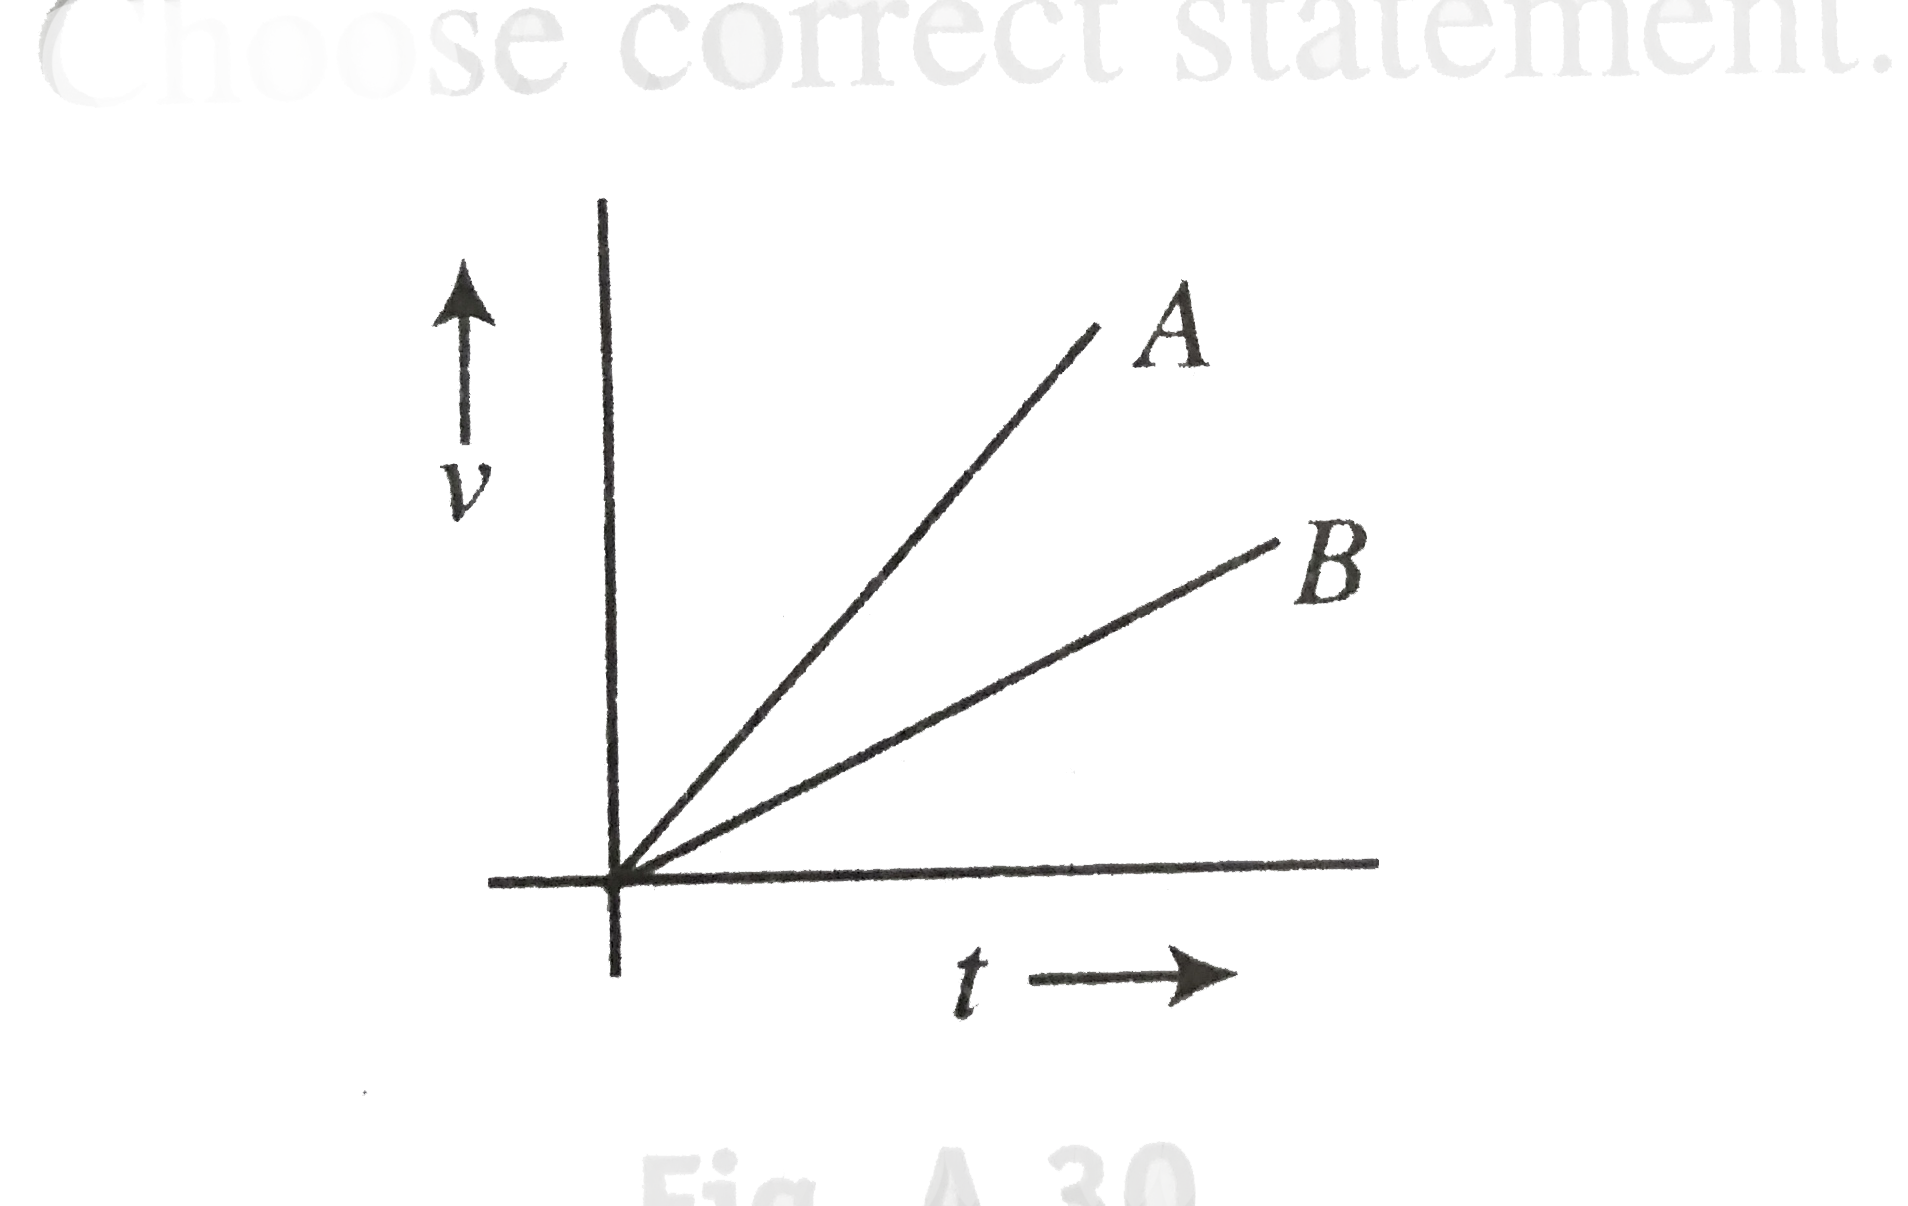 Aacceleration of Bgt acceleration of ABacceleration of A gt acceleration of BCboth are starting from same pointDA covers greater distance than B in the same time.
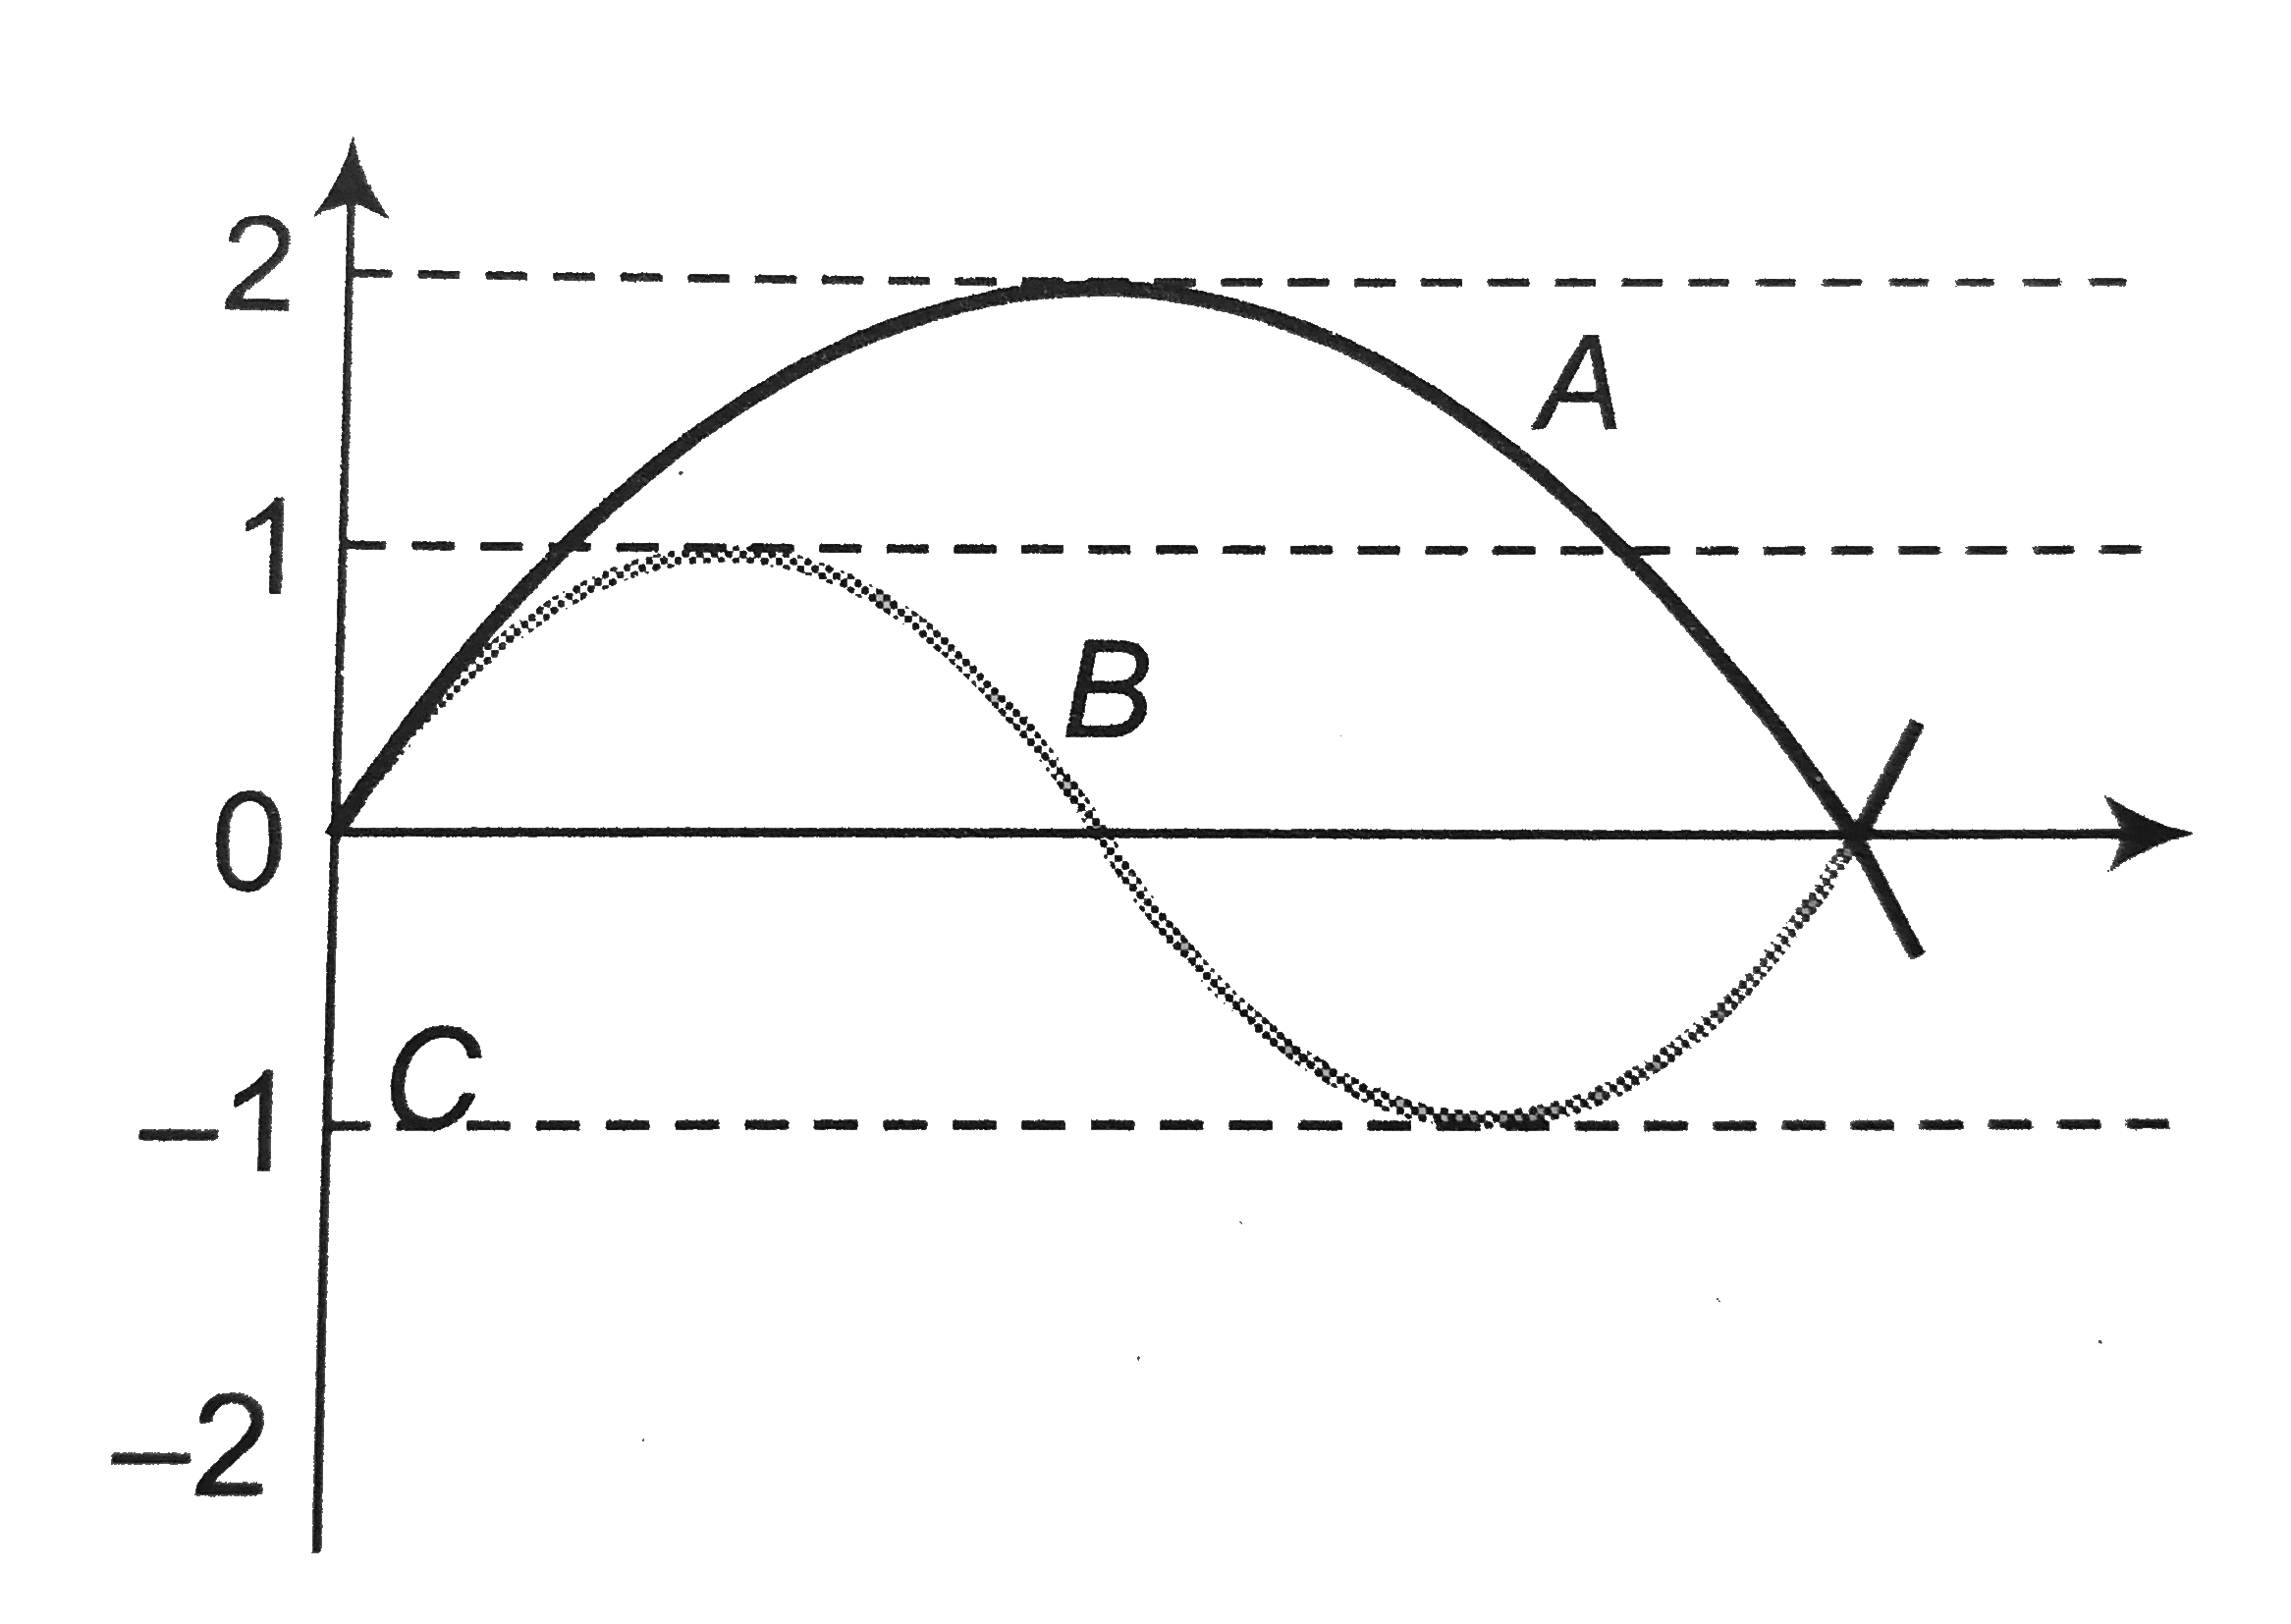
The displacement time graph for two sound waves A and B are shown in the figure. Then the ratio of their intensities IA/IB is equal toA1:4B1:16C1:2D1:1The velocity − time graph of a particle is as shown in figure
 AIt moves with a constant acceleration throughoutBIt moves with an acceleration of constant magnitude but changing direction at the end of every two secondCThe displacement of the particle is zeroDThe velocity becomes zero at t=4 second
The velocity time graph of a body is as showh in
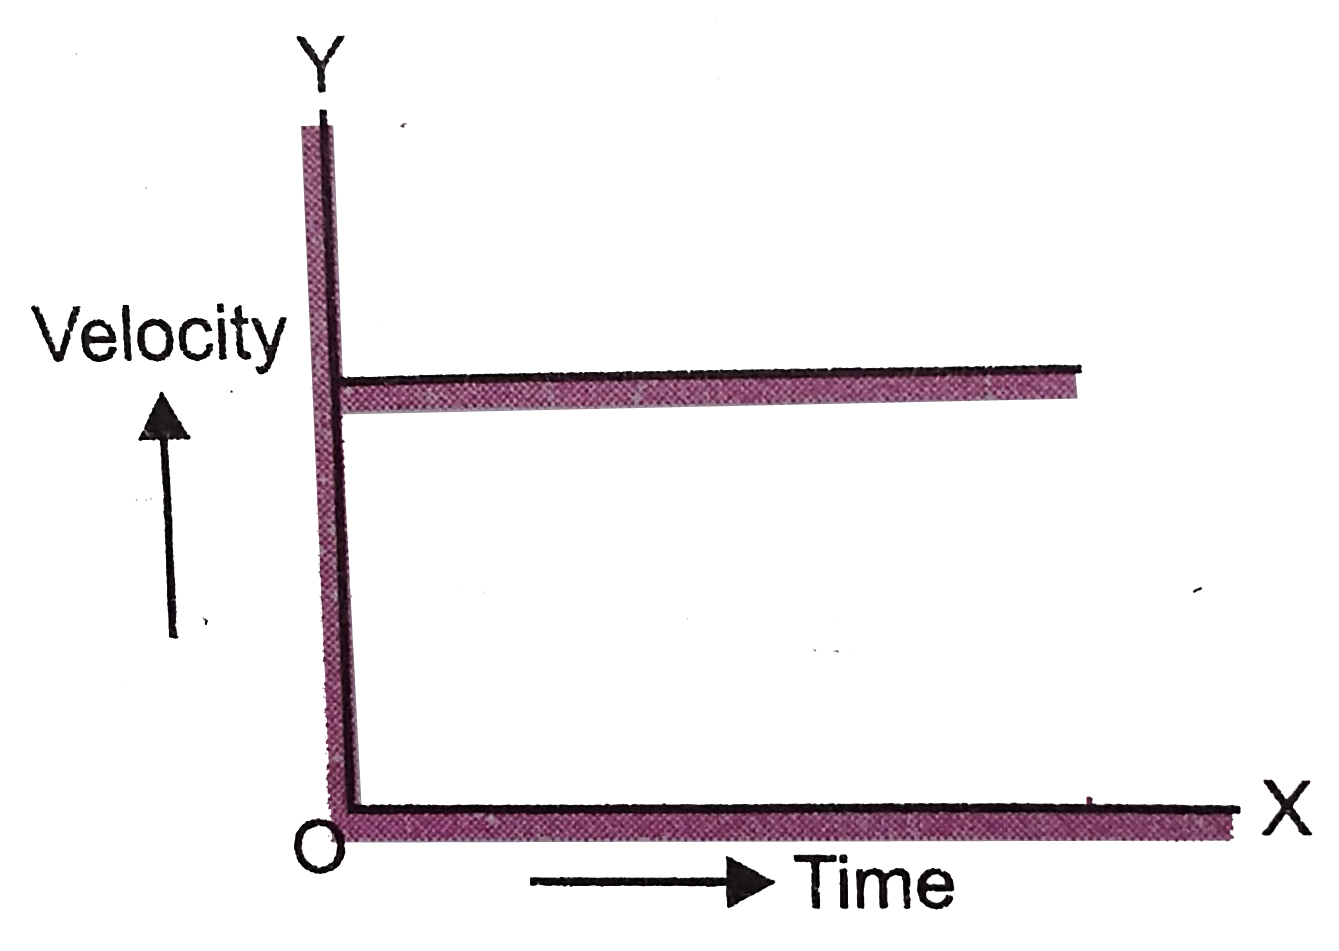
what would be the acceleration of the body ?
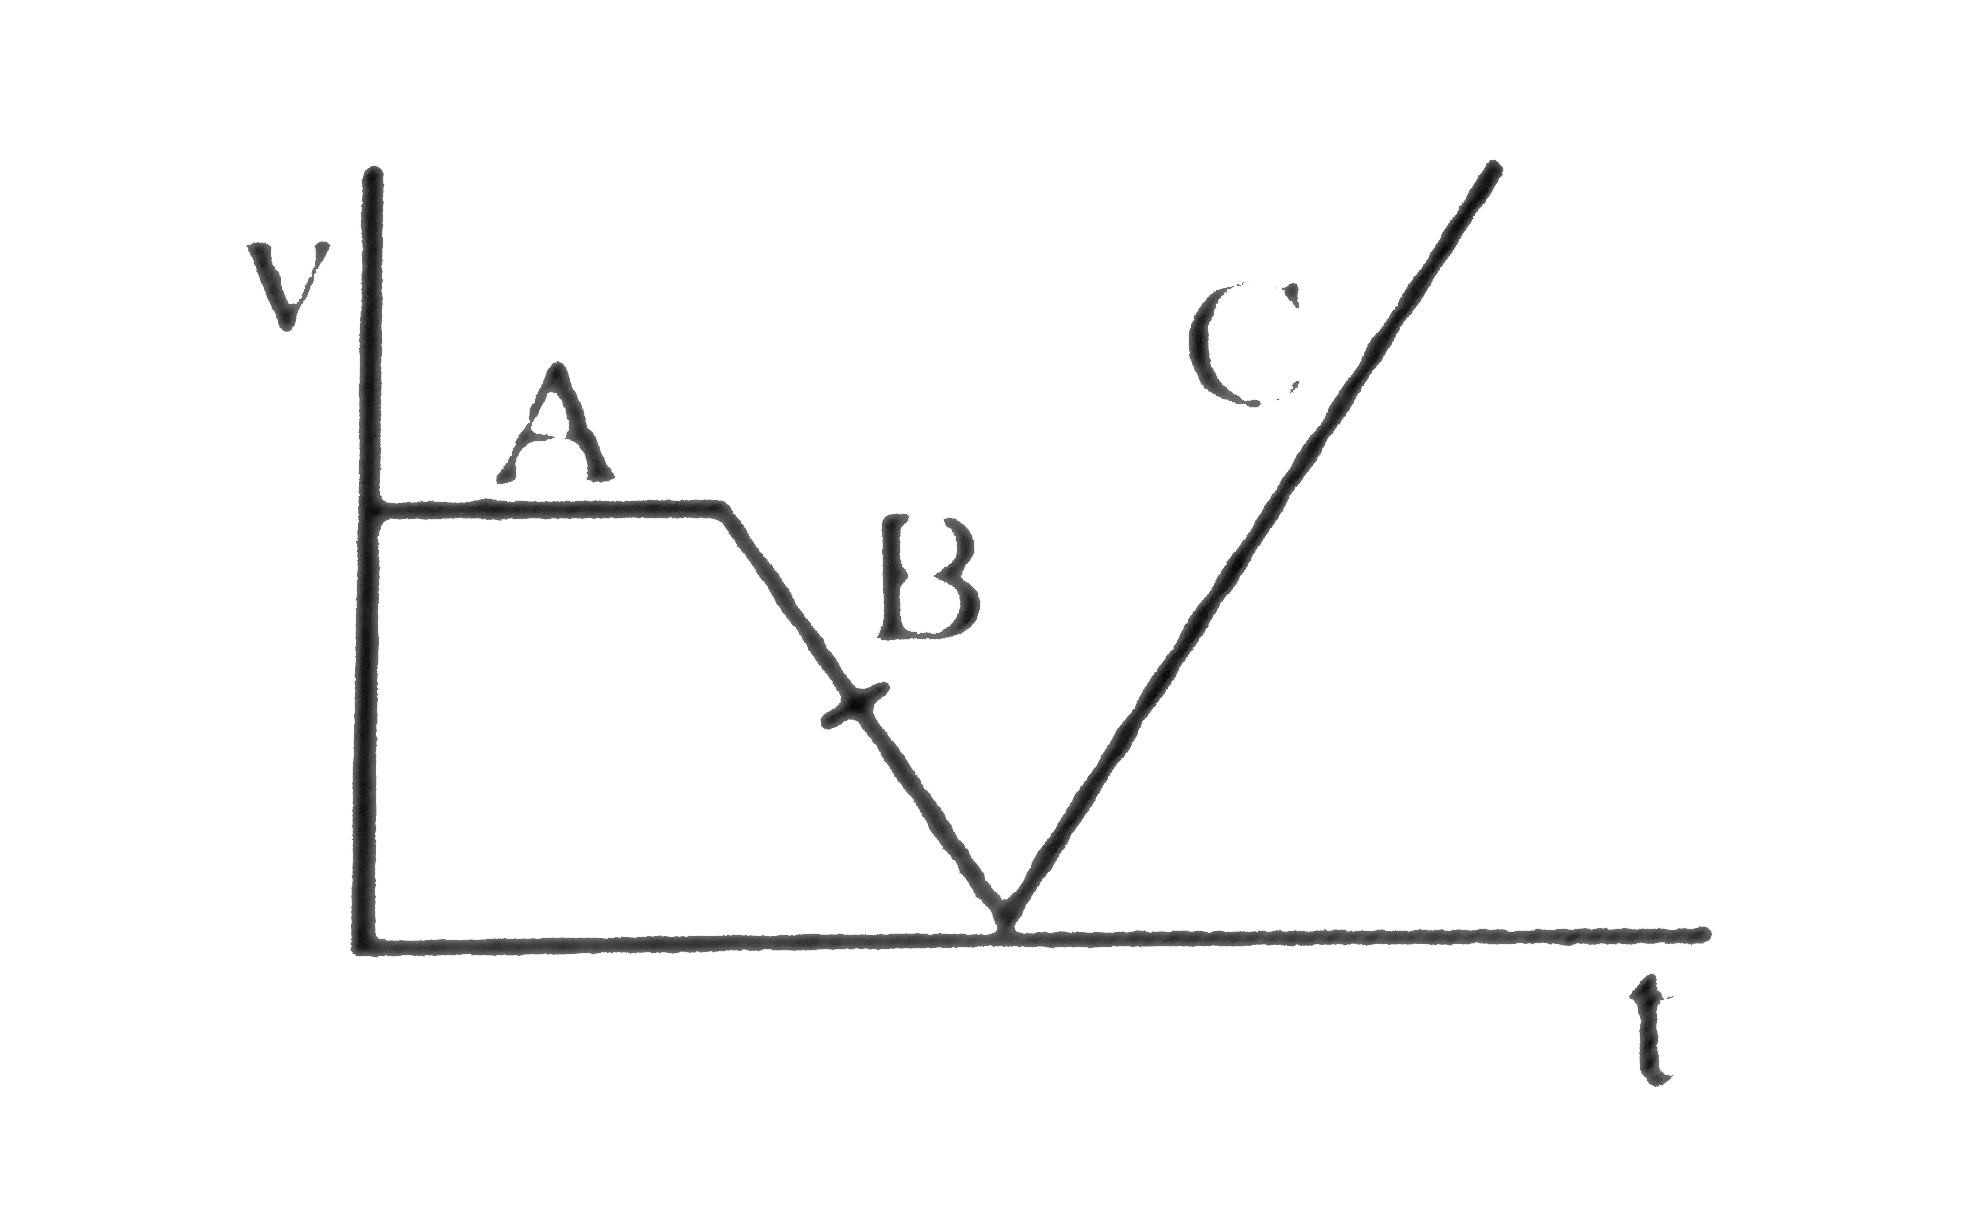
View SolutionVelocity versus time graph of a body is shown in figure. It explains that
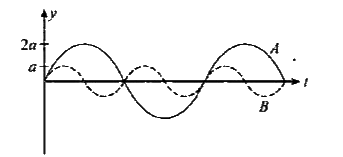
View SolutionThe displacement-time graphs for two sound waves A and 5 are shown in the figure-6.98, then the ratio oftheir intensities IA/IB is equal to:
View SolutionThe displacement time graphs of two bodies A and B are shown in figure. The ratio of velocity of A to velocity of B,vA/vB is:

View SolutionThe velocity - time graph is shown in the figure, for a particle. The acceleration of particle is
View Solution