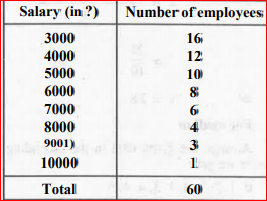
Find the mean salary of 60 workers of a factory from the following table :
 Solution in Punjabi
The correct Answer is:5083.33
Step by step video, text & image solution for Find the mean salary of 60 workers of a factory from the following table : by Maths experts to help you in doubts & scoring excellent marks in Class 9 exams.
Updated on:21/07/2023Topper's Solved these Questions
- STATISTICS BOOK - SWAN PUBLICATIONCHAPTER - STATISTICS EXERCISE - Objective Type Questions
16 Videos
- STATISTICS BOOK - SWAN PUBLICATIONCHAPTER - STATISTICS EXERCISE - Objective Type Questions (Fill in Blanks:)
1 Videos
- STATISTICS BOOK - SWAN PUBLICATIONCHAPTER - STATISTICS EXERCISE - EXERCISE 14.3
17 Videos
- QUADRILATERALSBOOK - SWAN PUBLICATIONCHAPTER - QUADRILATERALSEXERCISE - Objective Type Questions ( Fill in the Blanks)
10 Videos
- SURFACE AREAS AND VOLUMES BOOK - SWAN PUBLICATIONCHAPTER - SURFACE AREAS AND VOLUMES EXERCISE - Objective Type Questions (Fill in the Blanks )
7 Videos
Similar Questions
What is raw data or ungrouped data ?
View SolutionThe mid value of the class intervals is known as the ...........
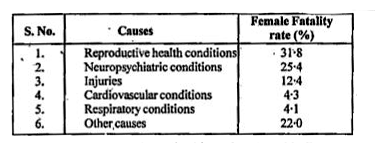
View SolutionA survey conducted by an organisation for the cause of illness and death among the women between the ages 15-44 (in years) worldwide, found the following figures (in %):

Represent the information given above graphically.
View SolutionSum of the angles of a quadrilateral is ................ .
View SolutionTotal surface area of a cone = ..............
View SolutionWhich of the following are correct chain isomers of butane ? (i)
View SolutionDetermine the point of symmetry of a regular hexagon.
View SolutionDtermine the images of the following figure about the given line :
View SolutionMatch the following Column A to Column B

View SolutionMatch the following Column A to Column B

View SolutionMatch the following Column A to Column B

View SolutionFind the area of figure given below.

View SolutionFind the perimeter of the figure given below.

View SolutionFind the area of the figure given below.

View SolutionThe inequation represented by the graph given below is :
View SolutionThe inequation that best describes the graph given below is _________
View Solution
