In the half yearly examination, the marks scored by a student in each subject out of 100 are given below :
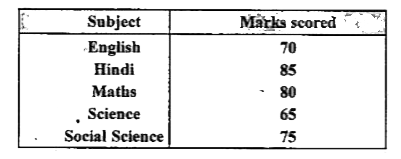
Draw a pictograph taking the scale in which one picture =10 marks and answer the following questions :
(i) In which subject the maximum marks are obtained ?
(ii) In which subject the student has to do more hard work ?
(iii) What is the difference between the maximum and minimum marks ?Solution in Punjabi
The correct Answer is:(i) Hindi, (ii) Science, (iii0 20
Step by step video, text & image solution for In the half yearly examination, the marks scored by a student in each subject out of 100 are given below : Draw a pictograph taking the scale in which one picture =10 marks and answer the following questions : (i) In which subject the maximum marks are obtained ? (ii) In which subject the student has to do more hard work ? (iii) What is the difference between the maximum and minimum marks ? by Maths experts to help you in doubts & scoring excellent marks in Class 6 exams.
Updated on:21/07/2023Topper's Solved these Questions
- DATA HANDLING BOOK - SWAN PUBLICATIONCHAPTER - DATA HANDLING EXERCISE - EXERCISE 14.3
5 Videos
- DATA HANDLING BOOK - SWAN PUBLICATIONCHAPTER - DATA HANDLING EXERCISE - MULTIPLE CHOICE QUESTIONS
9 Videos
- DATA HANDLING BOOK - SWAN PUBLICATIONCHAPTER - DATA HANDLING EXERCISE - MULTIPLE CHOICE QUESTIONS
9 Videos
- BASIC GEOMETRICAL CONCEPTSBOOK - SWAN PUBLICATIONCHAPTER - BASIC GEOMETRICAL CONCEPTSEXERCISE - MULTIPLE CHOICE QUESTIONS
12 Videos
- DECIMALSBOOK - SWAN PUBLICATIONCHAPTER - DECIMALSEXERCISE - MULTIPLE CHOICE QUESTIONS
20 Videos
Similar Questions
Read the adjoining bar graph showing the number of students in a particular class of a school:
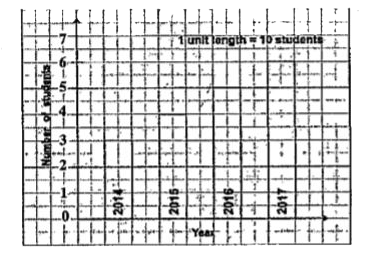
Answer tbe following questions :
(i) What is the scale of.this graph ?
(ii) How many students are there in 2016 ?
(iii) Is the number of students in the year 2017 twice the year 2014 ?
View SolutionIf * represents 10 flowers then how many flowers does * * * * * represent?
View SolutionIf * represents 10 flowers then how many flowers does * * * * * represent?
View SolutionHow many lines can pass through a point ?
View Solution3+210=.............
View SolutionThe following pie chart gives the marks scored in an examination by a student in various subjects . If the total marks obtained by the student were 360 , answer the questions.
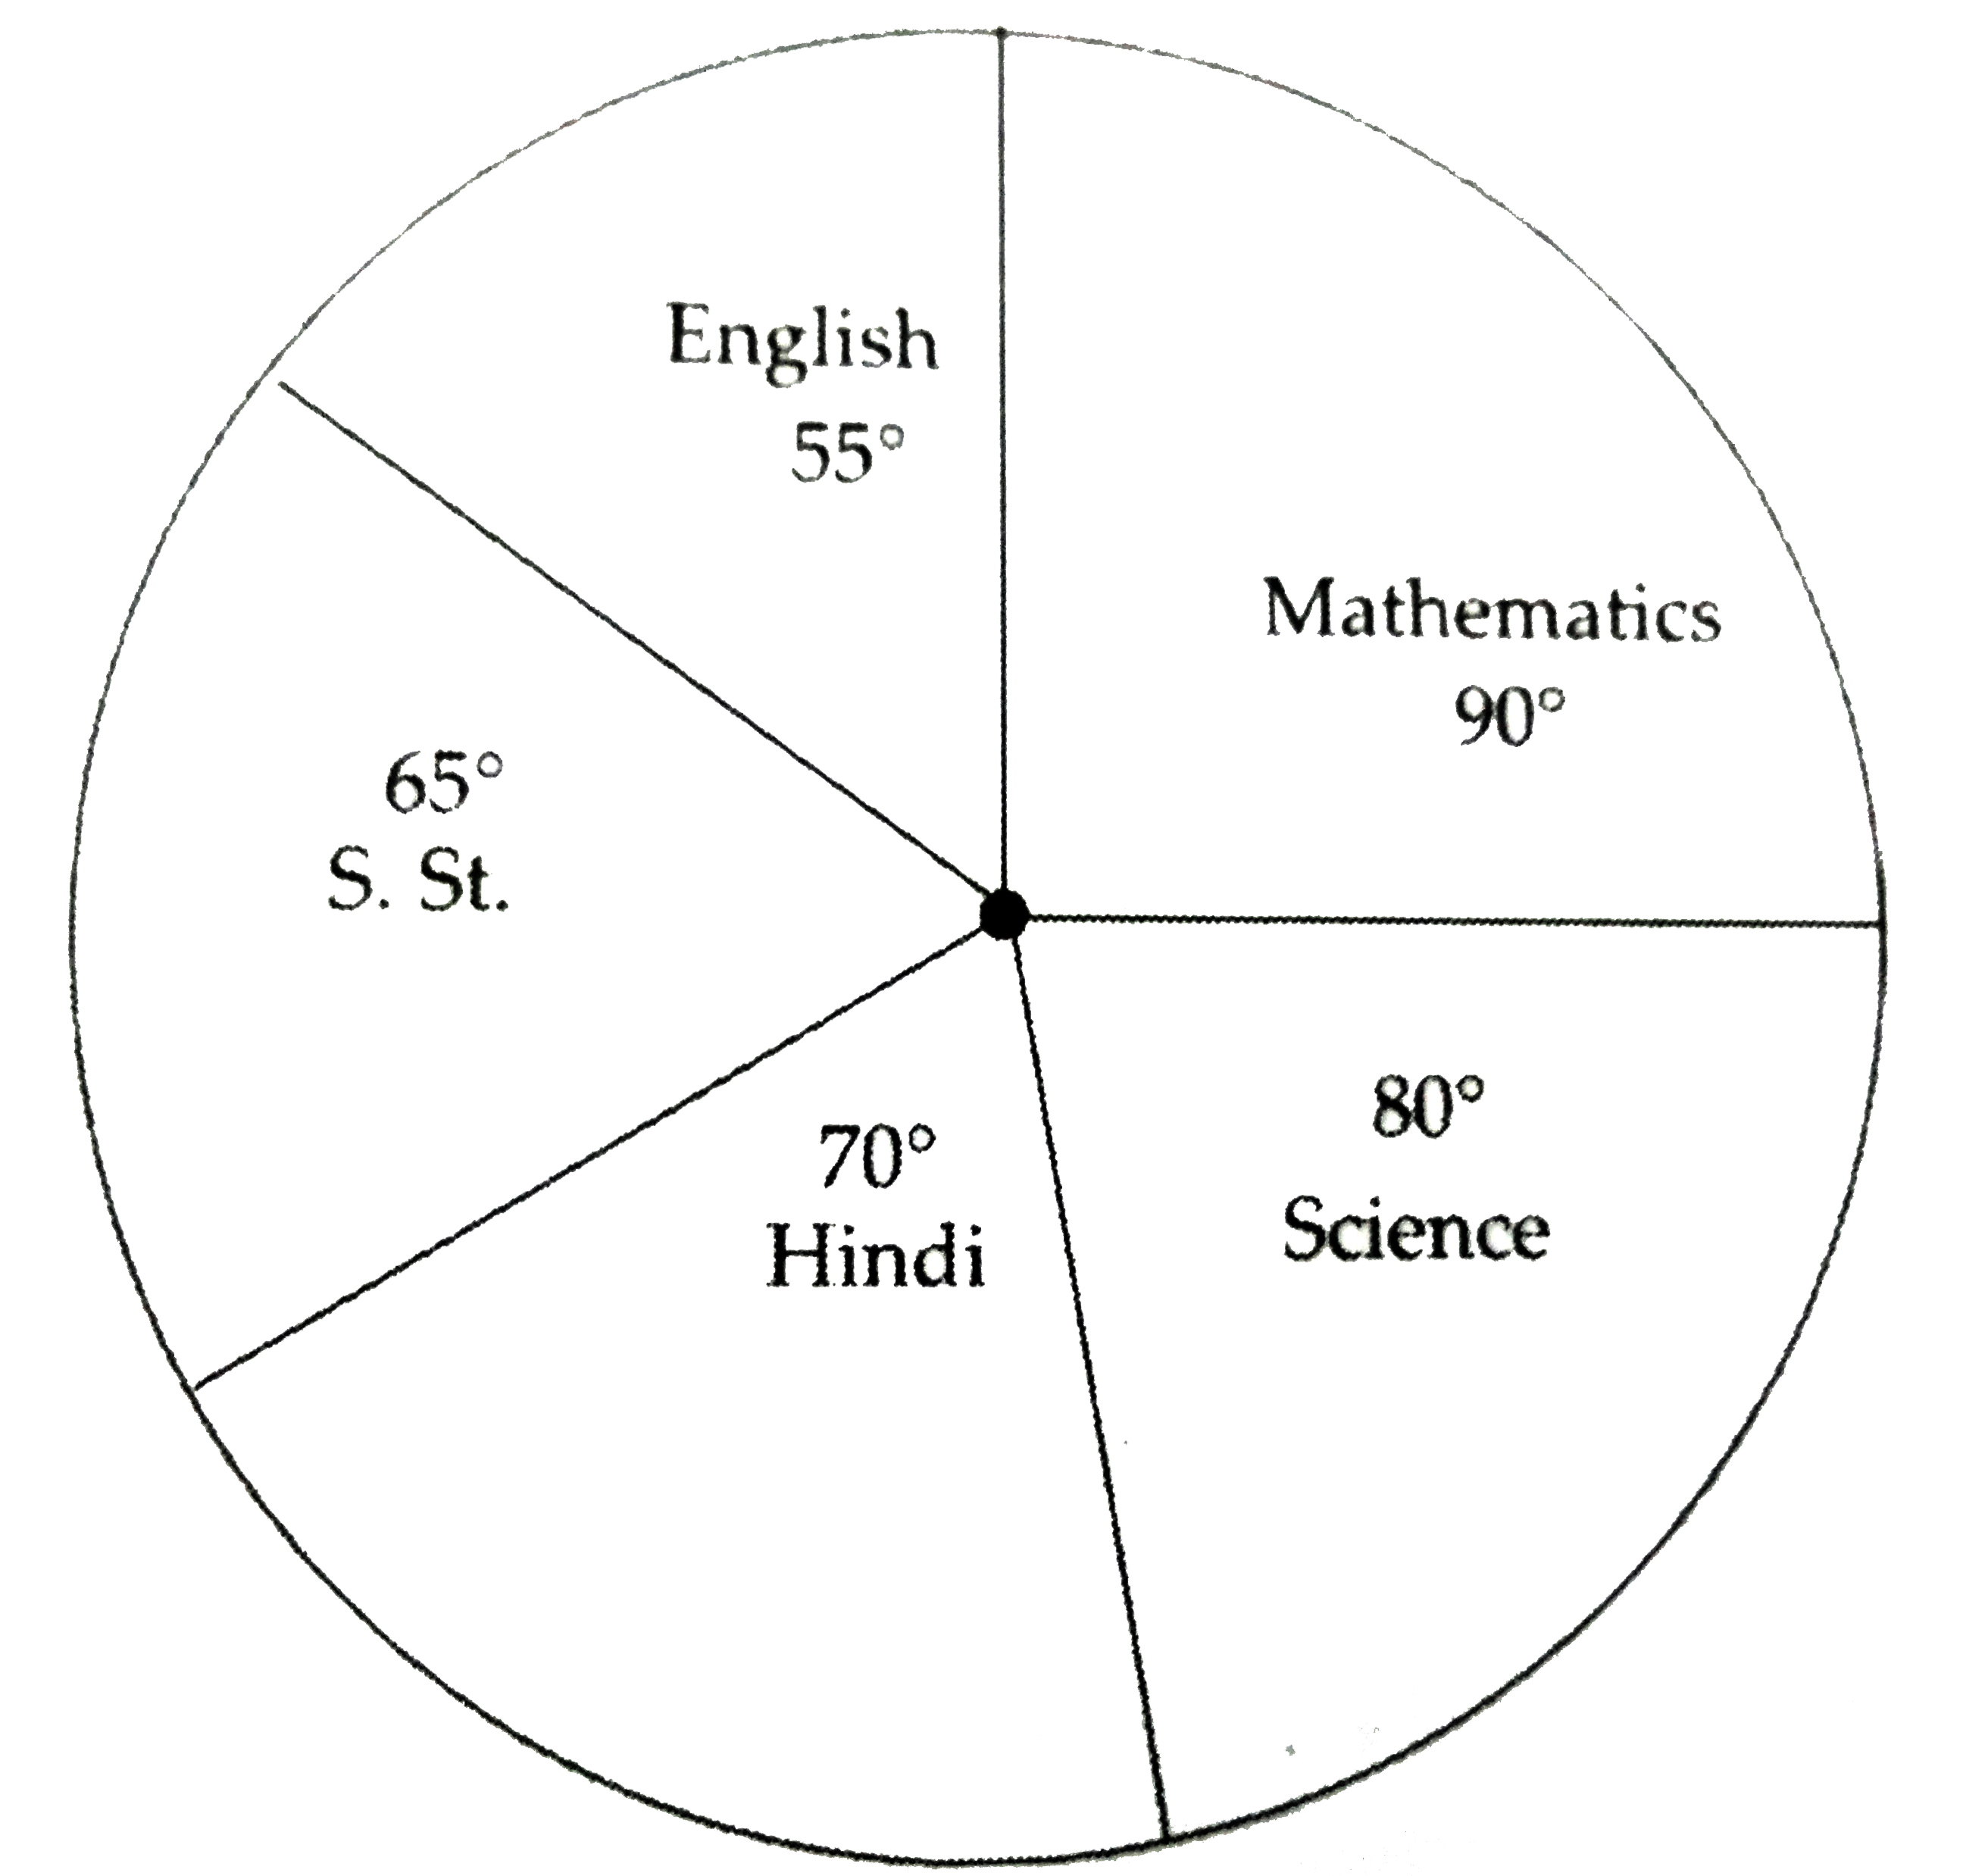
Find the marks obtained in each subject.
View SolutionThe following pie chart gives the marks scored in an examination by a student in various subjects . If the total marks obtained by the student were 360 , answer the questions.
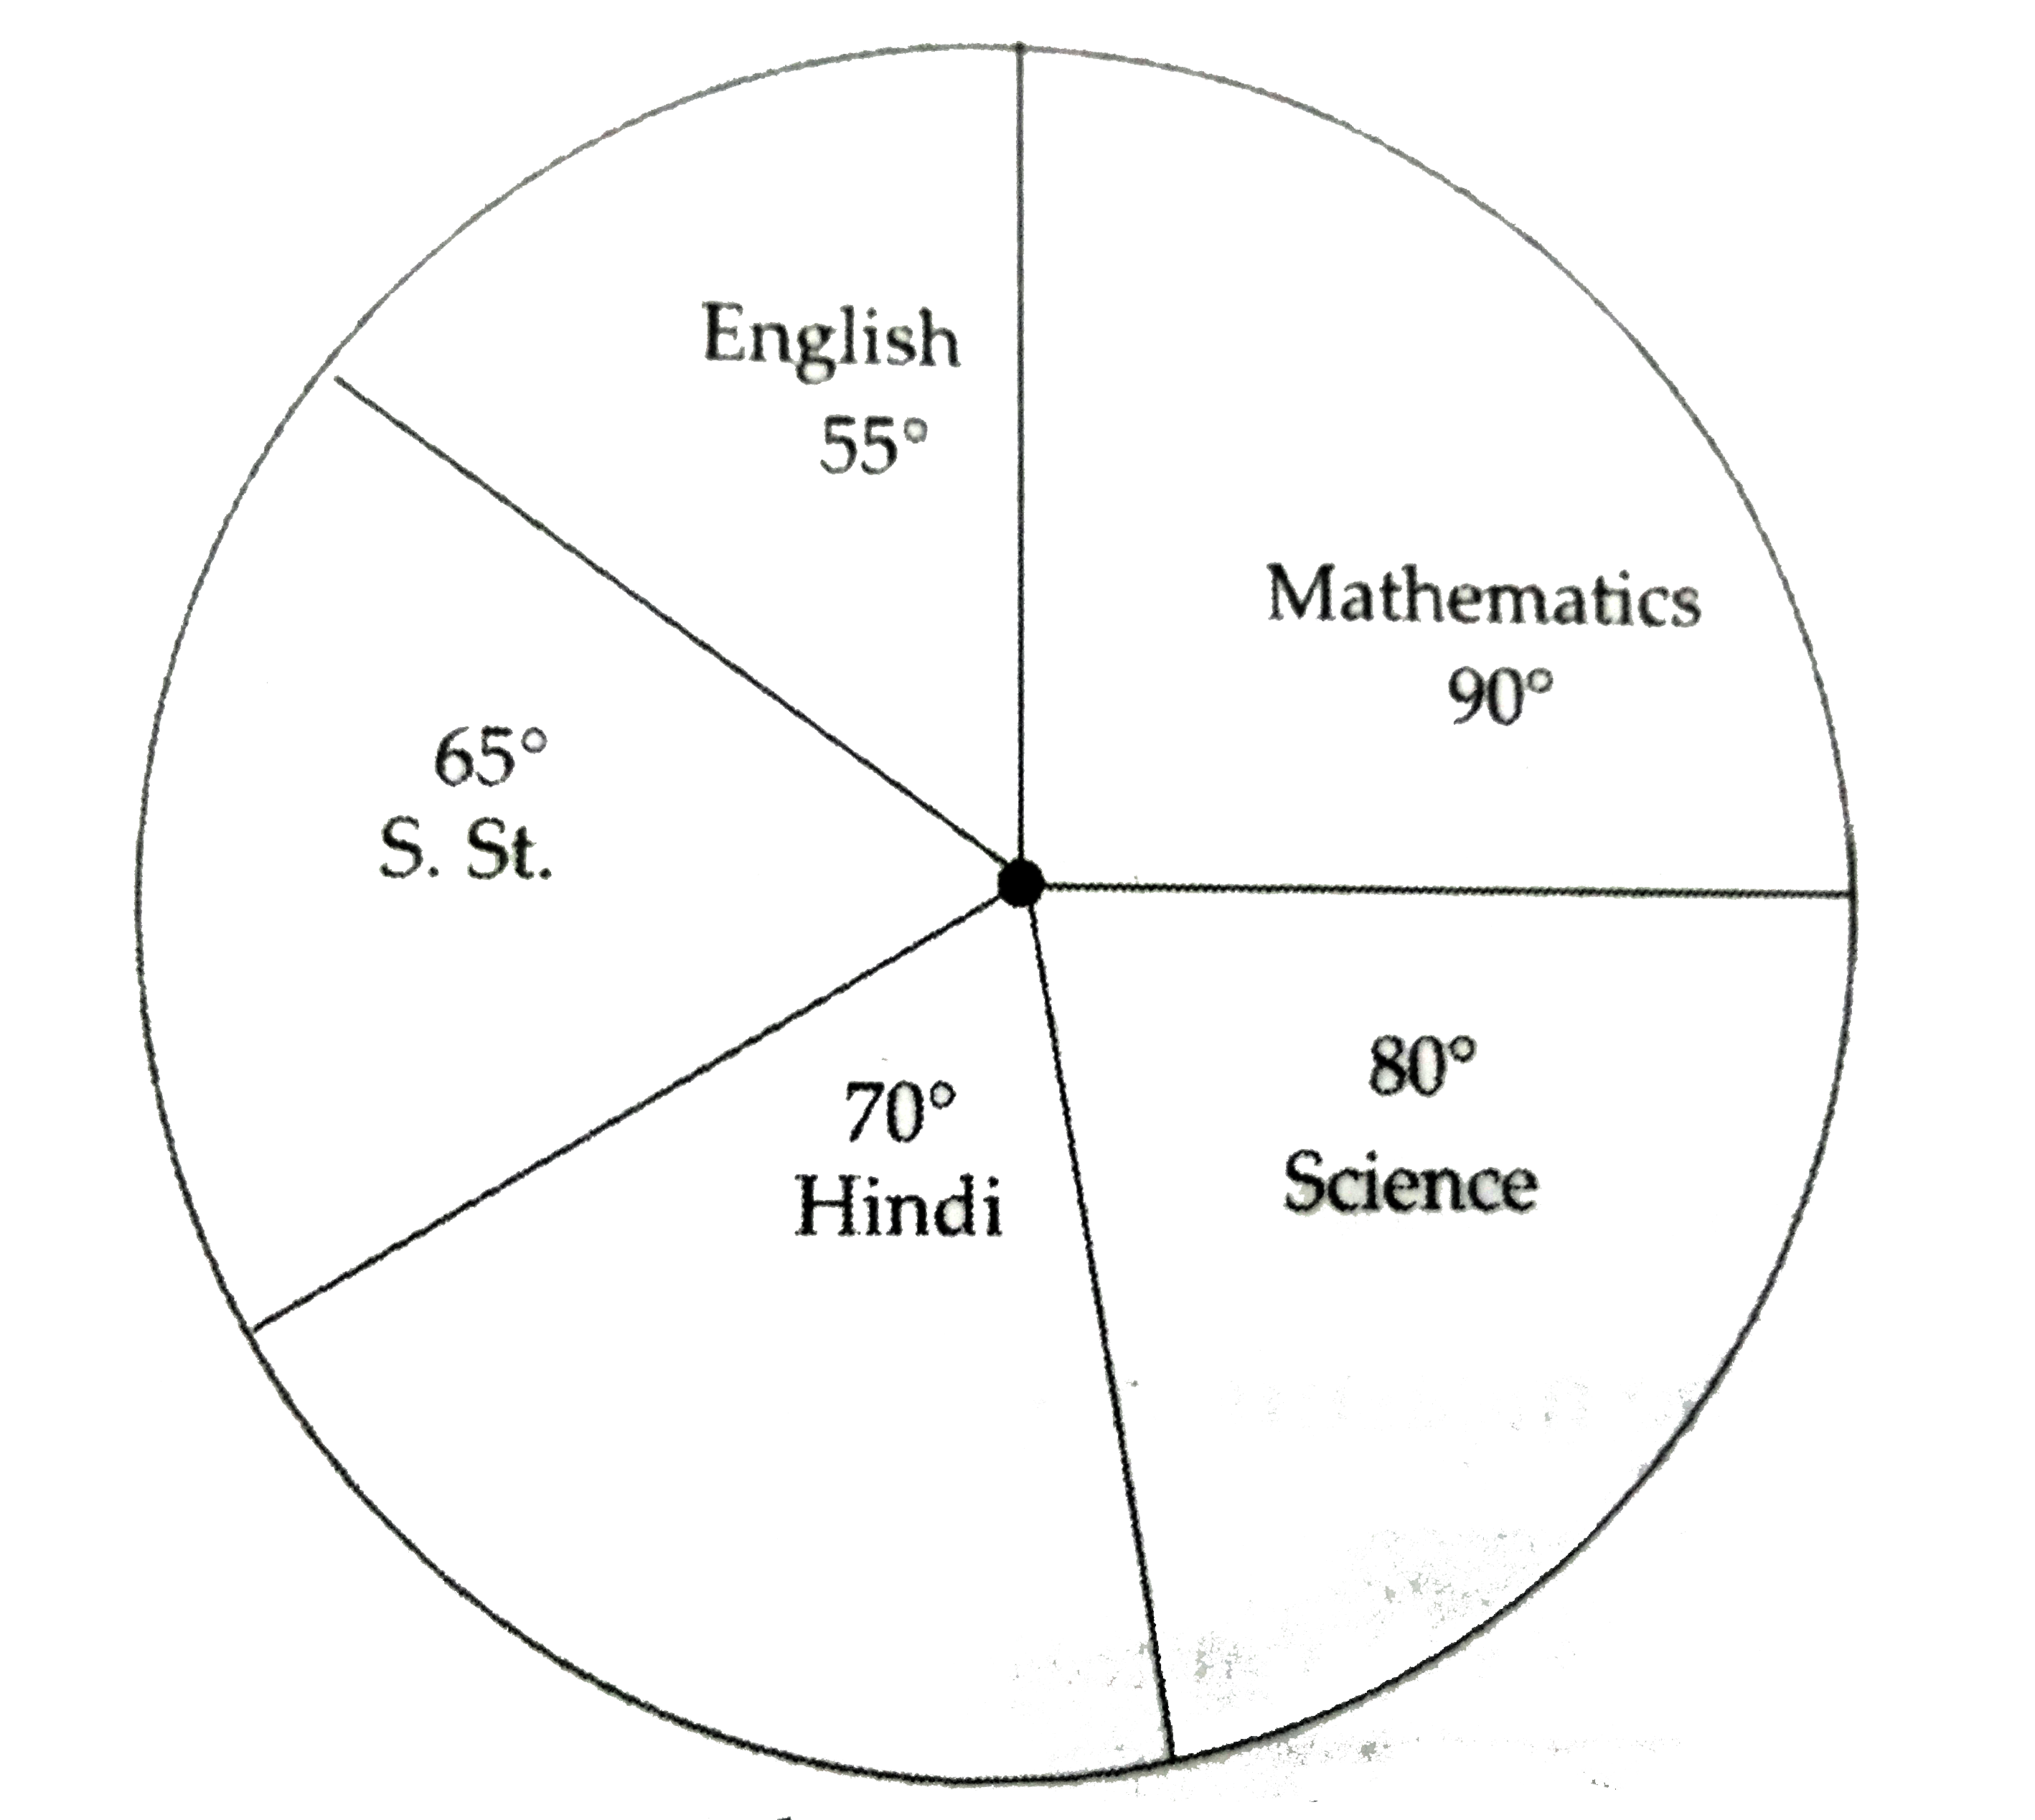
which subject he get the least marks ?
View SolutionThe table given below represents the marks obtained by 5 students in 4 different subjects. Each student was given marks out of 100 in each of the given subjects. In which subject the total marks of all the students is highest ?
View SolutionThe table given below represents the marks obtained by 5 students in 4 different subjects. Each student was given marks out of 100 in each of the given subjects.

Which student scored the maximum marks in all the 4 subjects taken together ?
View SolutionThe attached pie chart shows the marks obtained by a student in various subjects in an examination. If the total score obtained by that student is 1080, then answer the following questions. In which subject did the student get 180 marks?
View SolutionThe attached pie chart shows the marks obtained by a student in various subjects in an examination. If the total score obtained by that student is 1080, then answer the following questions. In which subject did that student get the highest marks?
View SolutionThe pie chart given below shows the marks obtained by a student in different subjects in an examination. If the total marks obtained by him was 540, then answer the following questions (i) In which subject did the student get 105 marks? (ii) How much more marks did that student get in Mathematics than Hindi?
View SolutionThe pie chart gives the marks scored in an examination by a student in different subjects. If the total marks obtained were 540, answer the following questions
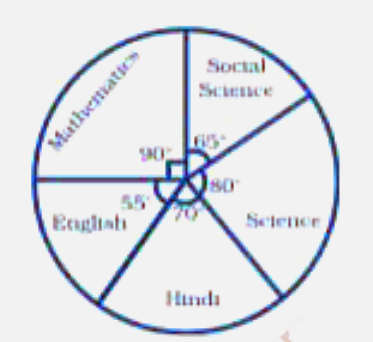
In which subject did the student score 105 marks?
View SolutionThe bar graph shows the marks obtained by Kashish in half-yearly examination in various subjects.
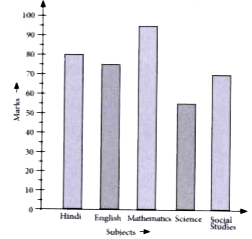
Draw a pictograph for the above data and then answer the following questions.
Name the subjects in which Kashish scored minimum and maximum marks.
View SolutionThe marks (out of 100) obtained by a student in his quarterly examination in various subjects are given below :
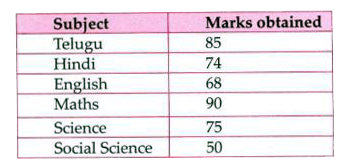
The total percentage of marks scored by the student is.
View Solution
