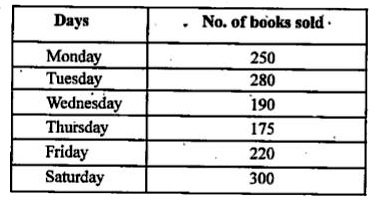
The number of books sold by a shopkeeper on the different days are shown below :

On which day, the sale is maximum ?Solution in Punjabi
Saturday
Friday
Thursday
Wednesday
The correct Answer is:a
Step by step video, text & image solution for The number of books sold by a shopkeeper on the different days are shown below : On which day, the sale is maximum ? by Maths experts to help you in doubts & scoring excellent marks in Class 6 exams.
Topper's Solved these Questions
- BOOK - SWAN PUBLICATIONCHAPTER - DATA HANDLING EXERCISE - EXERCISE 14.35videos
DATA HANDLING
- BOOK - SWAN PUBLICATIONCHAPTER - DATA HANDLING EXERCISE - MULTIPLE CHOICE QUESTIONS9videos
DATA HANDLING
- BOOK - SWAN PUBLICATIONCHAPTER - DATA HANDLING EXERCISE - MULTIPLE CHOICE QUESTIONS9videos
DATA HANDLING
- BOOK - SWAN PUBLICATIONCHAPTER - BASIC GEOMETRICAL CONCEPTSEXERCISE - MULTIPLE CHOICE QUESTIONS12videos
BASIC GEOMETRICAL CONCEPTS
- BOOK - SWAN PUBLICATIONCHAPTER - DECIMALSEXERCISE - MULTIPLE CHOICE QUESTIONS20videos
DECIMALS
Similar Questions
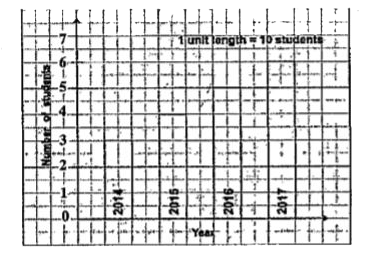
Read the adjoining bar graph showing the number of students in a particular class of a school:

Answer tbe following questions :
(i) What is the scale of.this graph ?
(ii) How many students are there in 2016 ?
(iii) Is the number of students in the year 2017 twice the year 2014 ?06:07View SolutionIf * represents 10 flowers then how many flowers does * * * * * represent?
02:11View SolutionIf * represents 10 flowers then how many flowers does * * * * * represent?
02:45View SolutionHow many lines can pass through a point ?
02:17View Solution3+210=.............
05:41View SolutionWhich of the following are correct chain isomers of butane ? (i)
02:21View SolutionDetermine the point of symmetry of a regular hexagon.
02:03View SolutionMatch the following Column A to Column B
 02:10View Solution
Match the following Column A to Column B
 02:17View Solution
Match the following Column A to Column B
 02:10View Solution
Find the area of the figure given below.
 04:23View Solution
The area of the shaded part in the figure given below is ______.
 01:59View Solution
The inequation represented by the graph given below is :
01:19View SolutionThe inequation that best describes the graph given below is _________
01:32View SolutionThe inequation that best describes the following graph is _________
04:05View SolutionWhich inequations represent the shaded region in the given figure
01:45View Solution

