For which of these would you use a histogram to show the data : The number of letters for different areas in a postman’s bag. Give reasons for eachSolution in Punjabi
Step by step video & image solution for For which of these would you use a histogram to show the data : The number of letters for different areas in a postman’s bag. Give reasons for each by Maths experts to help you in doubts & scoring excellent marks in Class 8 exams.
Updated on:21/07/2023Topper's Solved these Questions
- DATA HANDLINGBOOK - SWAN PUBLICATIONCHAPTER - DATA HANDLINGEXERCISE - Exercise 5.2
11 Videos
- DATA HANDLINGBOOK - SWAN PUBLICATIONCHAPTER - DATA HANDLINGEXERCISE - Exercise 5.3
13 Videos
- DATA HANDLINGBOOK - SWAN PUBLICATIONCHAPTER - DATA HANDLINGEXERCISE - Try These
27 Videos
- CUBES AND CUBE ROOTS BOOK - SWAN PUBLICATIONCHAPTER - CUBES AND CUBE ROOTS EXERCISE - EXERCISE 7.2
9 Videos
- DIRECT AND INVERSE PROPORTIONS BOOK - SWAN PUBLICATIONCHAPTER - DIRECT AND INVERSE PROPORTIONS EXERCISE - Exercise 13.2
16 Videos
Similar Questions
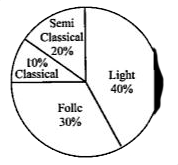
A survey was made to find the type of music that a certain group of young people liked in a city. Adjoining pie chart shows the findings of this survey.

Find this pie chart answer the following
(i) If 20 people liked classical music, how many young people were surveyed?
(ii) Which type of music is liked by the maximum number of people?
(iii) If a cassette company were to make 1000 CD's how many of each type would they make?
View SolutionList the outcomes you can see in these experiments: Spinning a wheel

View SolutionDraw an appropriate graph to represent the given information.

View SolutionFind the cube root of each of the following numbers by prime factorisation method : 175616
View SolutionWhich of the following are in inverse proportion : The number of workers on a job and the time to complete the job.
View SolutionFor which of these would you use a histogram to show the data?
(a) The number of letters for different areas in a postman’s bag.
(b) The height of competitors in an athletics meet.
(c) The number of cassettes produced by 5 companies.
(d) The number of passengers boarding trains from 7:00 a.m. to 7:00 p.m. at a station.
Give reasons for each.
View SolutionYou are conducting artificial hybridization on papaya and potato. Which one of them would require the step of emasculation and why? However for both you will use the process of bagging. Justify giving one reason.
View Solutionनिम्नलिखित मे से किन आकंड़ों को दर्शाने के लिए आप एक आयतचित्र का प्रयोग करेंगे ?
(a) एक डाकिये के थैले में विभिन्न क्षेत्रों के पत्रों की संख्या ।
(b) किसी खेलकूद प्रतियोगिता में प्रत्याशियों की ऊँचाइया।
(c) 5 कंपनियों द्वारा निर्मित कैसेटों की संख्या ।
(d) किसी स्टेशन पर प्रातः 7 बजे से सायं 7 बजे तक रेलगाड़िओं से जाने वाले यात्रियों की संख्या ।
प्रत्येक के लिए, कारण भी दीजिये ।
View SolutionRepresent the following data using a histogram.

View SolutionFor which of these would you use a histogram to show the data?(a) The number of letters for different areas in a postman’s bag.(b) The height of competitors in an athletics meet.(c) The number of cassettes produced by 5 companies.(d) The number of passengers boarding trains from 7:00 a.m. to 7:00 p.m. at a station. Give reasons for each.
View SolutionYou are conducting artificial hybridization on papaya and potato. Which one of them would require the step of emasculation and why? However for both you will use the process of bagging. Justify giving one reason.
View SolutionFor which of these would you use a histogram to show the data?
The number of letters for different areas in a postman's bag.
View SolutionFor which of these would you use a histogram to show the data?
The height of competitors in an athletics meet.
View SolutionFor which of these would you use a histogram to show the data?
The number of cassettes produced by 5 companies.
View SolutionFor which of these would you use a histogram to show the data?
The number of passengers boarding trains form 7.00 a.m. to 7.00 p.m at a station.
Give reasons for each.
View SolutionFor which of these would you use a histogram to show the data : The number of letters for different areas in a postman’s bag. Give reasons for each
View Solution
