Draw a histogram for the frequency table made for the data in Question 3,and answer the following questions. How many workers earn Rs 850 and more ?Solution in Punjabi
Step by step video & image solution for Draw a histogram for the frequency table made for the data in Question 3,and answer the following questions. How many workers earn Rs 850 and more ? by Maths experts to help you in doubts & scoring excellent marks in Class 8 exams.
Updated on:21/07/2023Topper's Solved these Questions
- DATA HANDLINGBOOK - SWAN PUBLICATIONCHAPTER - DATA HANDLINGEXERCISE - Exercise 5.2
11 Videos
- DATA HANDLINGBOOK - SWAN PUBLICATIONCHAPTER - DATA HANDLINGEXERCISE - Exercise 5.3
13 Videos
- DATA HANDLINGBOOK - SWAN PUBLICATIONCHAPTER - DATA HANDLINGEXERCISE - Try These
27 Videos
- CUBES AND CUBE ROOTS BOOK - SWAN PUBLICATIONCHAPTER - CUBES AND CUBE ROOTS EXERCISE - EXERCISE 7.2
9 Videos
- DIRECT AND INVERSE PROPORTIONS BOOK - SWAN PUBLICATIONCHAPTER - DIRECT AND INVERSE PROPORTIONS EXERCISE - Exercise 13.2
16 Videos
Similar Questions
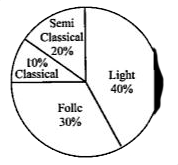
A survey was made to find the type of music that a certain group of young people liked in a city. Adjoining pie chart shows the findings of this survey.

Find this pie chart answer the following
(i) If 20 people liked classical music, how many young people were surveyed?
(ii) Which type of music is liked by the maximum number of people?
(iii) If a cassette company were to make 1000 CD's how many of each type would they make?
View SolutionList the outcomes you can see in these experiments: Spinning a wheel

View SolutionDraw an appropriate graph to represent the given information.

View SolutionFind the cube root of each of the following numbers by prime factorisation method : 175616
View SolutionWhich of the following are in inverse proportion : The number of workers on a job and the time to complete the job.
View SolutionDraw a histogram for the frequency table made for the data in Question 3, and answer the following questions.(i) Which group has the maximum number of workers?(ii) How many workers earn Rs 850 and more?(iii) How many workers earn less than Rs 850?
View SolutionThe weekly wages (in Rs.) of 30 workers in a factory are give: 830,835,890,810,835,836,869,845,898,890, 820,860,832,833,855,845,804,808,812,,840,885,835,835,836,878,840,868,890,806,840 Mark a frequency table with intervals as 800-810, 810-820 and so on, using tally marks.
View Solutionप्रश्न 4 में दिए आकंड़ों से प्राप्त सारणी के लिए एक आयतचित्र बनाइए और निम्नलिखित प्रश्नो के उत्तर दीजिये :
(i) किस समूह में श्रमिकों की संख्या सबसे अधिक है ?
(ii) कितने श्रमिक Rs. 850 या उससे अधिक अर्जित करते है ?
(iii) कितने श्रमिक Rs. 850 से कम अर्जित करते है ?
View SolutionDraw a histogram for the frequency table made for the data in Question 3, and answer the following questions.(i) Which group has the maximum number of workers?(ii) How many workers earn Rs 850 and more?(iii) How many workers earn less than Rs 850?
View SolutionThe weekly wages (in Rs.) of 30 workers in a factory are give: 830,835,890,810,835,836,869,845,898,890, 820,860,832,833,855,845,804,808,812,,840,885,835,835,836,878,840,868,890,806,840 Mark a frequency table with intervals as 800-810, 810-820 and so on, using tally marks. Also, draw a histogram and answer the following questions: Which group has the maximum number of workers? How many workers earn Rs. 850 and more? How many workers earn less than Rs. 850?
View Solutionਪ੍ਰਸ਼ਨ 3 ਵਿੱਚ ਦਿੱਤੇ ਅੰਕੜਿਆਂ ਤੋਂ ਪ੍ਰਾਪਤ ਸਾਰਣੀ ਦੇ ਲਈ ਇੱਕ ਆਇਤ ਚਿੱਤਰ ਬਣਾਉ ਅਤੇ ਹੇਠਾਂ ਲਿਖੇ ਪ੍ਰਸ਼ਨਾਂ ਦੇ ਉੱਤਰ ਦਿਓ : ਕਿੰਨੇ ਮਜ਼ਦੂਰ Rs 850 ਜਾਂ ਉਸ ਤੋਂ ਵੱਧ ਕਮਾਉਂਦੇ ਹਨ?
View Solutionਪ੍ਰਸ਼ਨ 3 ਵਿੱਚ ਦਿੱਤੇ ਅੰਕੜਿਆਂ ਤੋਂ ਪ੍ਰਾਪਤ ਸਾਰਣੀ ਦੇ ਲਈ ਇੱਕ ਆਇਤ ਚਿੱਤਰ ਬਣਾਉ ਅਤੇ ਹੇਠਾਂ ਲਿਖੇ ਪ੍ਰਸ਼ਨਾਂ ਦੇ ਉੱਤਰ ਦਿਓ : ਕਿੰਨੇ ਮਜ਼ਦੂਰ Rs 850 ਜਾਂ ਤੋਂ ਘੱਟ ਕਮਾਉਂਦੇ ਹਨ?
View Solutionप्रश्न 26 में दिए आँकड़ों से प्राप्त सारणी के लिए एक आयत चित्र बनाइए और निम्नलिखित प्रश्नों के उत्तर दीजिए :
(i) किस समूह में श्रमिकों की संख्या सबसे अधिक है ?
View Solutionप्रश्न 26 में दिए आँकड़ों से प्राप्त सारणी के लिए एक आयत चित्र बनाइए और निम्नलिखित प्रश्नों के उत्तर दीजिए :
(ii) कितने श्रमिक 850 रुपये या उससे अधिक अर्जित करते हैं ?
View Solutionप्रश्न 26 में दिए आँकड़ों से प्राप्त सारणी के लिए एक आयत चित्र बनाइए और निम्नलिखित प्रश्नों के उत्तर दीजिए :
(iii) कितने श्रमिक 850 रुपये से कम अर्जित करते हैं ?
View SolutionDraw a histogram for the frequency distribution table given in Example 13 as
(Data: 830, 835, 890, 810, 835, 836, 869, 845, 898, 890, 820, 860, 832, 833, 855, 845, 804, 808, 812, 840, 885, 835, 835, 836, 878, 840, 868, 890, 806, 840) and answer the following questions.
How many workers earn Rs. 820 or more but less than Rs. 880?
View Solution
