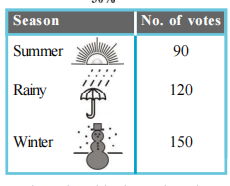
A group of 360 people were asked to vote for their favourite season from the three seasons rainy, winter and summer : Find the central angle of each sector.
 Solution in Punjabi
Step by step video & image solution for A group of 360 people were asked to vote for their favourite season from the three seasons rainy, winter and summer : Find the central angle of each sector. by Maths experts to help you in doubts & scoring excellent marks in Class 8 exams.
Updated on:21/07/2023Topper's Solved these Questions
- DATA HANDLINGBOOK - SWAN PUBLICATIONCHAPTER - DATA HANDLINGEXERCISE - Exercise 5.3
13 Videos
- DATA HANDLINGBOOK - SWAN PUBLICATIONCHAPTER - DATA HANDLINGEXERCISE - Exercise 5.1
12 Videos
- CUBES AND CUBE ROOTS BOOK - SWAN PUBLICATIONCHAPTER - CUBES AND CUBE ROOTS EXERCISE - EXERCISE 7.2
9 Videos
- DIRECT AND INVERSE PROPORTIONS BOOK - SWAN PUBLICATIONCHAPTER - DIRECT AND INVERSE PROPORTIONS EXERCISE - Exercise 13.2
16 Videos
Similar Questions
List the outcomes you can see in these experiments: Spinning a wheel

View SolutionFor which of these would you use a histogram to show the data : The number of letters for different areas in a postman’s bag. Give reasons for each
View SolutionFind the cube root of each of the following numbers by prime factorisation method : 175616
View SolutionWhich of the following are in inverse proportion : The number of workers on a job and the time to complete the job.
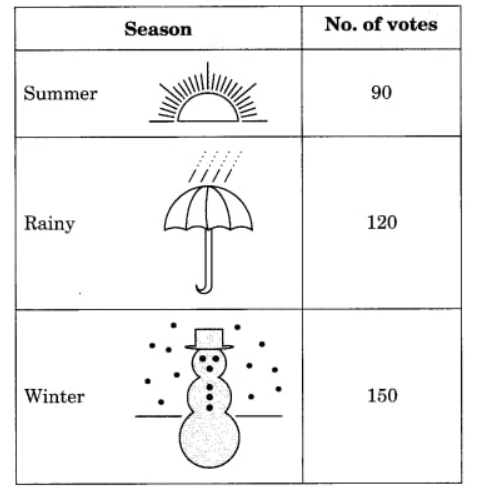
View SolutionA group of 360 people were asked to vote for their favourite season from the three seasons rainy, winter and summer.
(i) Which season got the most votes?
(ii) Find the central angle of each sector.
(iii) Draw a pie chart to show this information.
View SolutionDetermine the point of symmetry of a regular hexagon.
View SolutionMatch the following Column A to Column B

View SolutionMatch the following Column A to Column B

View SolutionMatch the following Column A to Column B

View SolutionThe inequation represented by the graph given below is :
View SolutionThe inequation that best describes the graph given below is _________
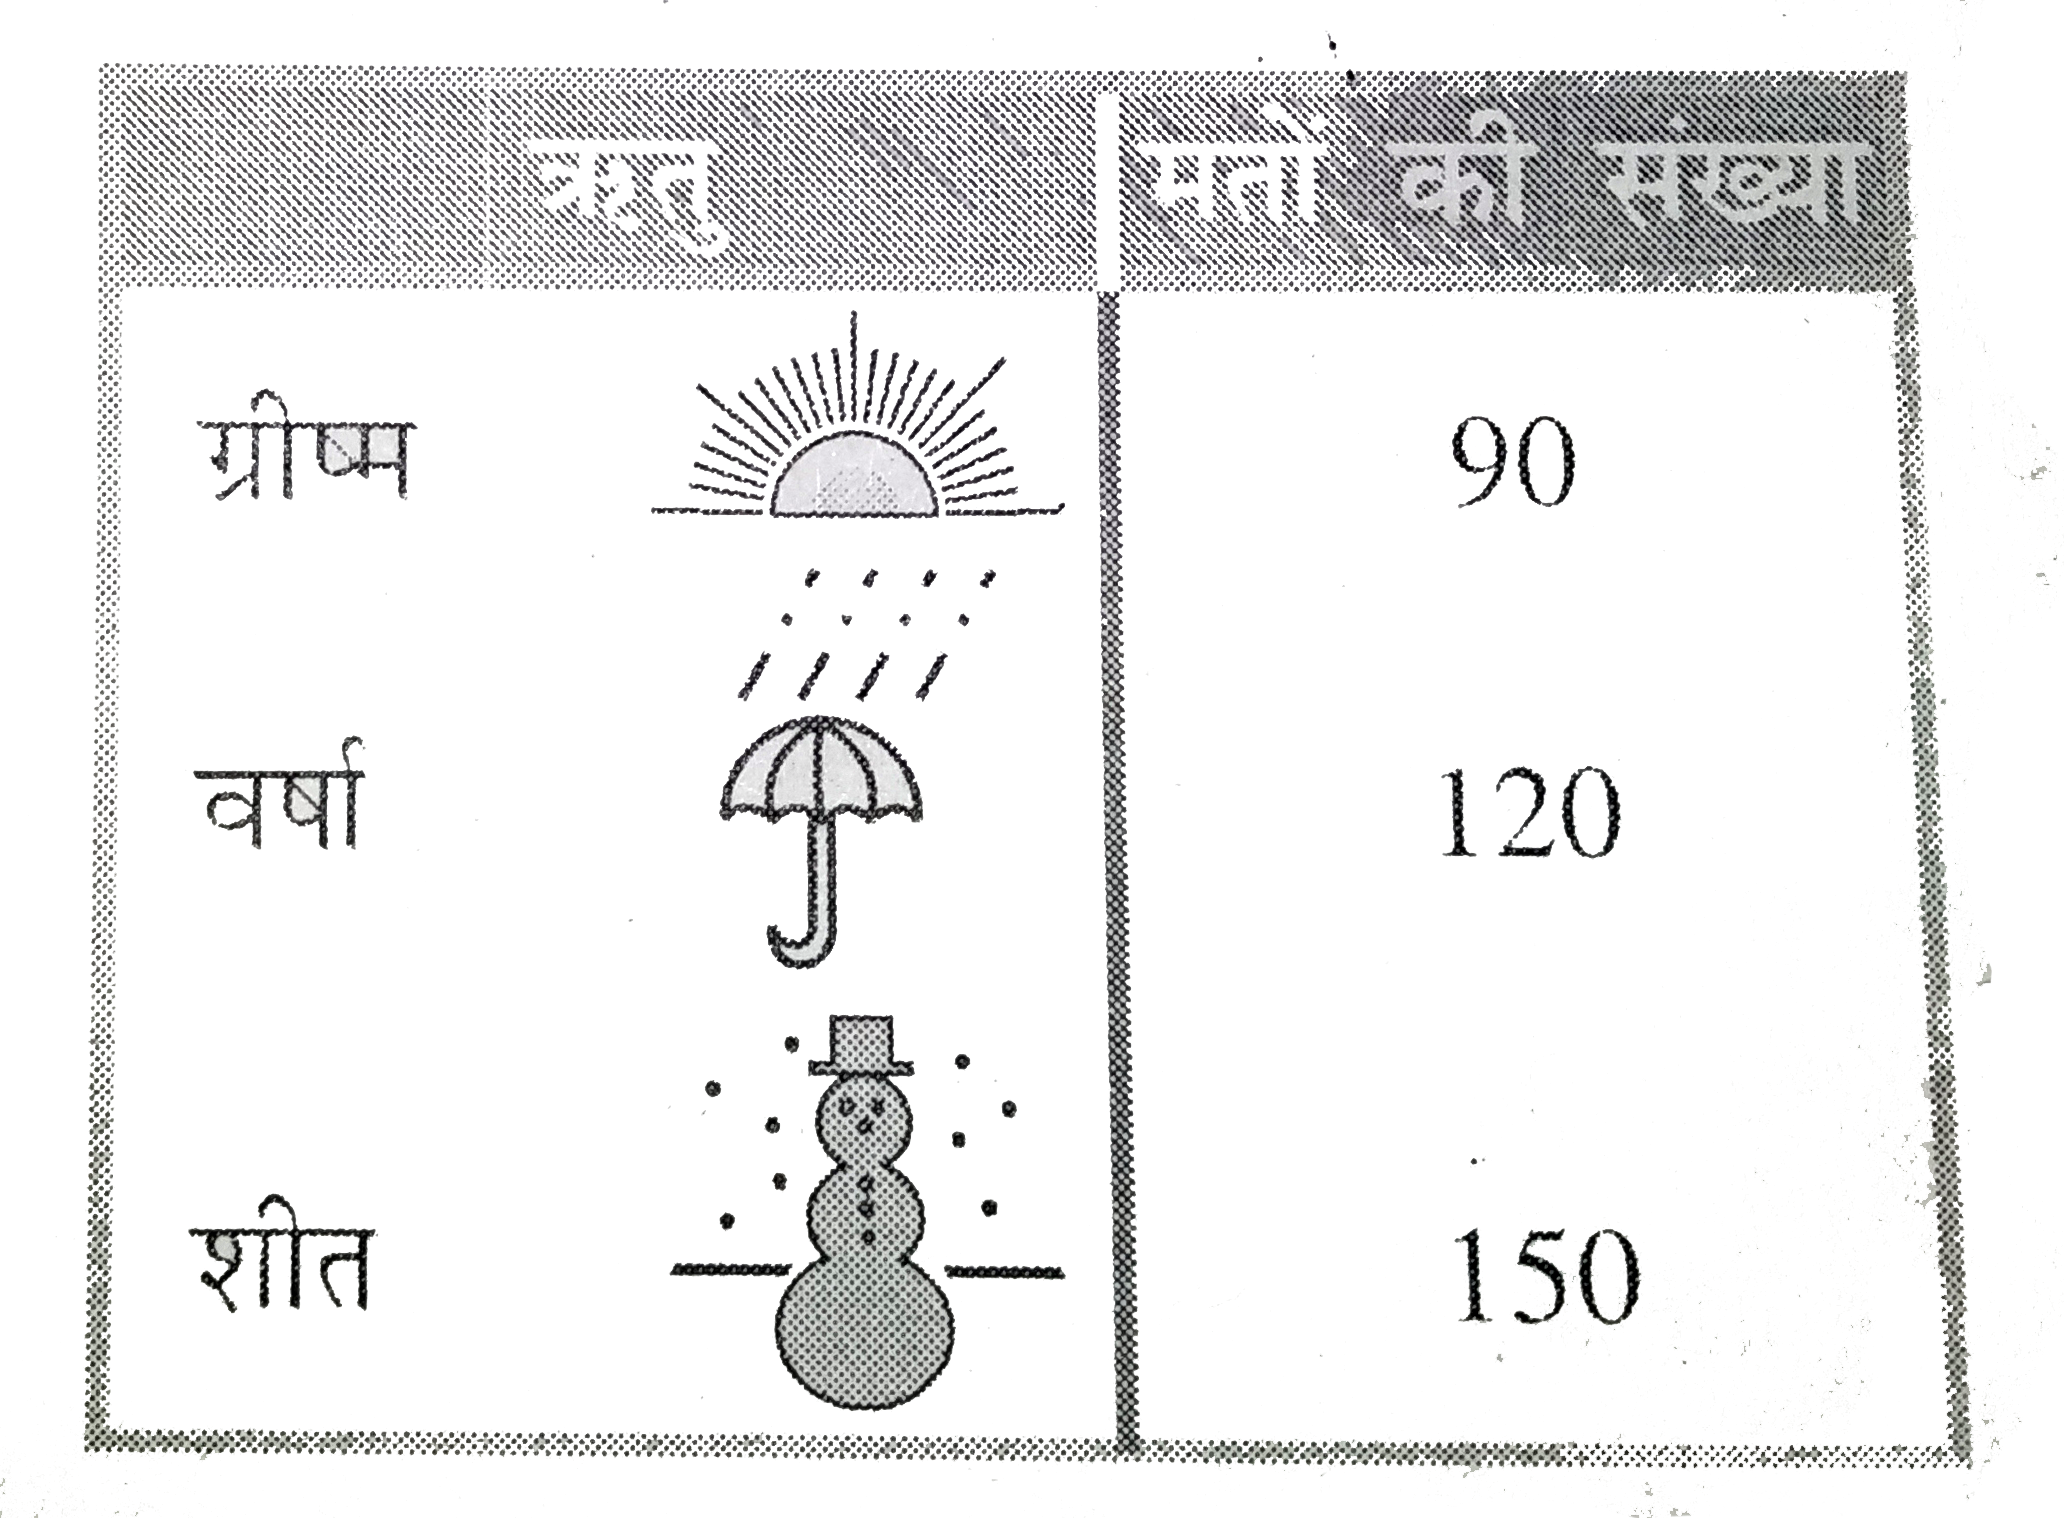
View Solution360 व्यक्तिओं के एक समूह से तीन ऋतुओं -वर्षा, सर्दी और गर्मी में से अपनी मनपसंद ऋतु के लिए मतदान करने को कहा गया । इनसे प्राप्त आँकड़े को संलग्न चित्र में दर्शाया गया है :
(i) किस ऋतु को सबसे अधिक मत मिले ?
(ii) प्रत्येक त्रिज्यखंड का केंद्रीय कोण ज्ञात कीजिए ।
(iii) इस सुचना को दर्शाने का केंद्रीय के लिए , एक पाई चार्ट खींचिए।
View SolutionA group of 360 people were asked to vote for their favourite season from the three seasons rainy, winter and summer.(i) Which season got the most votes?(ii) Find the central angle of each sector.(iii) Draw a pie chart to show this information.
View SolutionA group of 360 people were asked to vote for their favourite season from the three season rain,winter and summer.(i) Which season got the most votes? (ii) Find the central angle of each sector.(iii)Draw a pie chart to show this information.
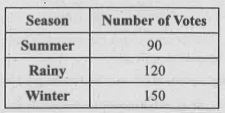
View SolutionA group of 360 people where asked to vote for their favourite season from the three seasons rainy, winter and summer.
Draw a pie chart to show this information.
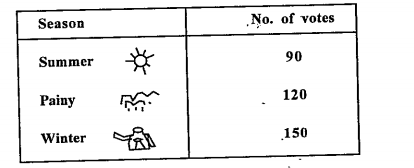
View SolutionA group of 360 people were asked to vote for their favorite season in the three seasons - winter, summer and winter. The figures obtained from this are shown in the accompanying figure. Which season got the most votes?
View Solution
