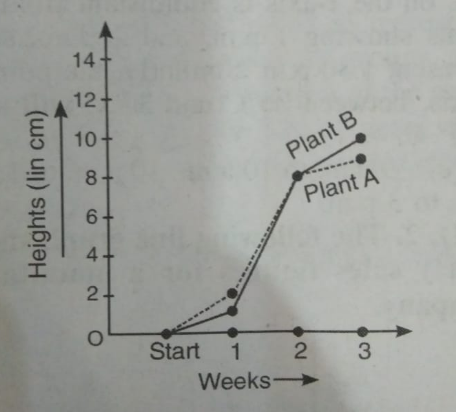
For an experiment in Botany,two different plants, plant A nad plant B were grown under similar laboratory conditions.Their heights were measured at the end of each week for 3 weeks.The results are shown by the following graph.
How high was plant A after
2 weeks?
3 weeks?
 Solution in Punjabi
The correct Answer is:(10- 7) cm = 3 cm
Step by step video, text & image solution for For an experiment in Botany,two different plants, plant A nad plant B were grown under similar laboratory conditions.Their heights were measured at the end of each week for 3 weeks.The results are shown by the following graph.How high was plant A after 2 weeks?3 weeks? by Maths experts to help you in doubts & scoring excellent marks in Class 8 exams.
Updated on:21/07/2023Topper's Solved these Questions
- INTRODUCTION TO GRAPHS BOOK - SWAN PUBLICATIONCHAPTER - INTRODUCTION TO GRAPHS EXERCISE - Exercise 15.2
8 Videos
- INTRODUCTION TO GRAPHS BOOK - SWAN PUBLICATIONCHAPTER - INTRODUCTION TO GRAPHS EXERCISE - Exercise 15.3
8 Videos
- INTRODUCTION TO GRAPHS BOOK - SWAN PUBLICATIONCHAPTER - INTRODUCTION TO GRAPHS EXERCISE - Try These
2 Videos
- FACTORISATIONBOOK - SWAN PUBLICATIONCHAPTER - FACTORISATIONEXERCISE - EXERCISE 14.4
23 Videos
- LINEAR EQUATIONS IN ONE VARIABLE BOOK - SWAN PUBLICATIONCHAPTER - LINEAR EQUATIONS IN ONE VARIABLE EXERCISE - EXERCISE 2.6
14 Videos
Similar Questions
Plot the following points on a graph sheet .Verify if they lie on a line.
A (4,0),B(4,2),C(4,6),D(4,2.5).
View SolutionDraw the graphs for the following tables of values , with suitable scales on the axes .
Cost of apples

View SolutionRefer to the graph given in fig.
How much petrol can be bought for Rs.600?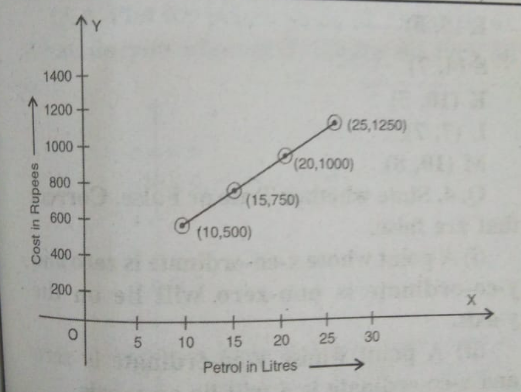
View SolutionFind and correct the errors in the following mathematical statement
4(x−5)=4x−5
View SolutionSolve the following equations. 8x−33x=2
View SolutionFor an experiement in Botany, two different plants, plant A and plant B were grown under similar laboratory conditions. Their heigths were measured at the end of each week for 3 weeks. The results are shown by the following graph.
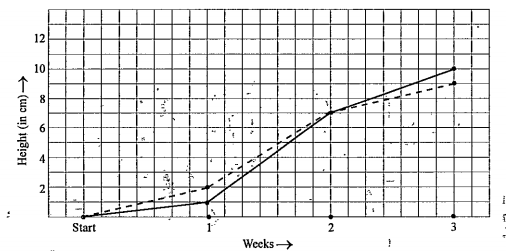
How high was Plant A after (i) 2 weeks (ii) 3 weeks?
View SolutionFor an experiment in Botany, two different plants, plant A and plant B were grown under similar laboratory conditions. Their heigths were measured at the end of each week for 3 weeks. The results are shown by the following graph.
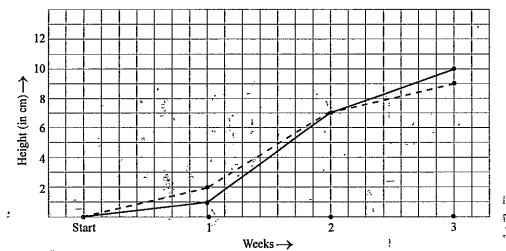
How high was Plant B after (i) 2 weeks (ii) 3 weeks?
View SolutionFor an experiment in Botany, two different plants, plant A and plant B were grown under similar laboratory conditions. Their heigths were measured at the end of each week for 3 weeks. The results are shown by the following graph.
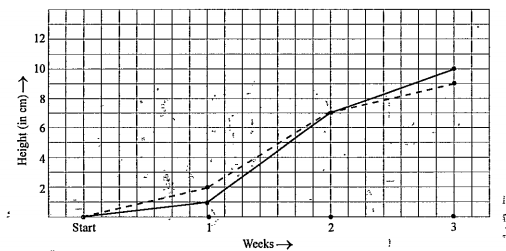
How much did Plant A grow during the 3rd week?
View SolutionFor an experiment in Botany, two different plants, plant A and plant B were grown under similar laboratory conditions. Their heigths were measured at the end of each week for 3 weeks. The results are shown by the following graph.
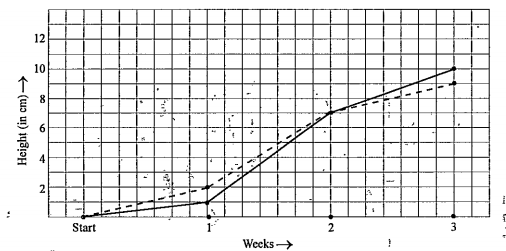
During which week did Plant A grow most?
View SolutionFor an experiement in Botany, two different plants, plant A and plant B were grown under similar laboratory conditions. Their heigths were measured at the end of each week for 3 weeks. The results are shown by the following graph.
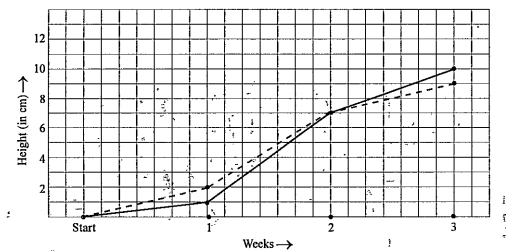
During which week did Plant B grow least?
View SolutionFor an experiment in Botany, two different plants, plant A and plant B were grown under similar laboratory conditions. Their heigths were measured at the end of each week for 3 weeks. The results are shown by the following graph.
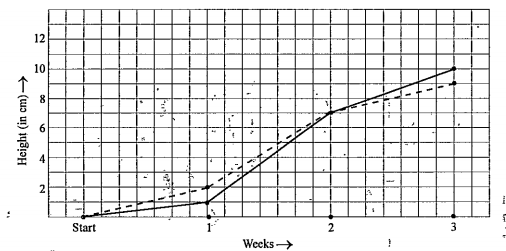
Were two Plants of the same height during any week shown here? Specify.
View SolutionFor an experiment in Botany, two different plants, plant A and plant B were grown under similar laboratory conditions. Their heights were measured at the end of each week for 3 weeks. The results are shown by the following graph.
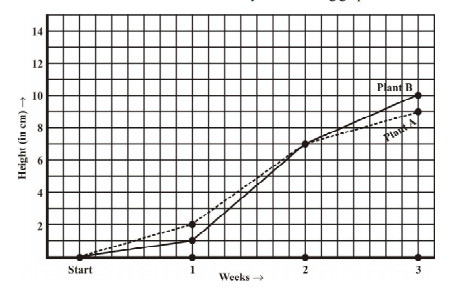 Were the two plants of the same height during any week shown here? Specify
View SolutionFor an experiment in Botany,two different plants, plant A nad plant B were grown under similar laboratory conditions.Their heights were measured at the end of each week for 3 weeks.The results are shown by the following graph.
How high was plant A after
2 weeks?
3 weeks?
View SolutionFor an experiment in Botany,two different plants, plant A nad plant B were grown under similar laboratory conditions.Their heights were measured at the end of each week for 3 weeks.The results are shown by the following graph.
During which week did Plant A grow most?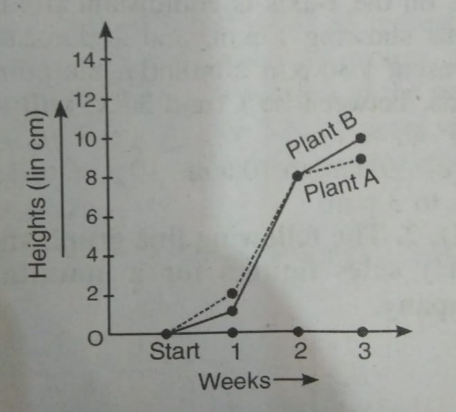
View SolutionFor an experiment in Botany,two different plants, plant A nad plant B were grown under similar laboratory conditions.Their heights were measured at the end of each week for 3 weeks.The results are shown by the following graph.
Were the two plants of the same height during any week shown here ?Specify.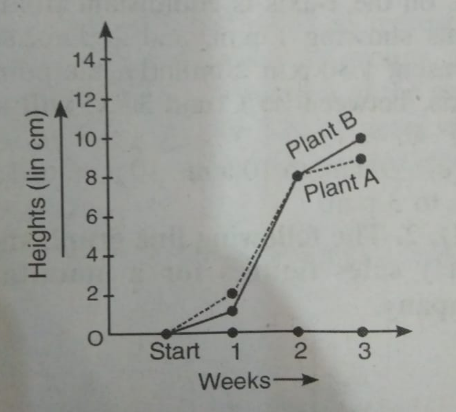
View SolutionFor an experiment in Botany,two different plants, plant A nad plant B were grown under similar laboratory conditions.Their heights were measured at the end of each week for 3 weeks.The results are shown by the following graph.
During which week did Plant A grow most?
View Solution