The following graph shows the temperature forecast and the actual temperature for each day of a week .
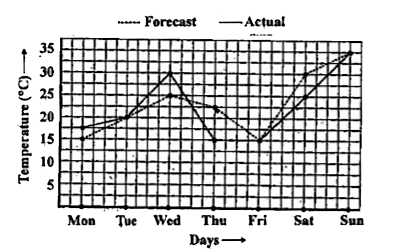
What was the minimum actual temperature during the week? Solution in Punjabi
The correct Answer is:15∘C
Step by step video, text & image solution for The following graph shows the temperature forecast and the actual temperature for each day of a week . What was the minimum actual temperature during the week? by Maths experts to help you in doubts & scoring excellent marks in Class 8 exams.
Updated on:21/07/2023Topper's Solved these Questions
- INTRODUCTION TO GRAPHS BOOK - SWAN PUBLICATIONCHAPTER - INTRODUCTION TO GRAPHS EXERCISE - Exercise 15.2
8 Videos
- INTRODUCTION TO GRAPHS BOOK - SWAN PUBLICATIONCHAPTER - INTRODUCTION TO GRAPHS EXERCISE - Exercise 15.3
8 Videos
- INTRODUCTION TO GRAPHS BOOK - SWAN PUBLICATIONCHAPTER - INTRODUCTION TO GRAPHS EXERCISE - Try These
2 Videos
- FACTORISATIONBOOK - SWAN PUBLICATIONCHAPTER - FACTORISATIONEXERCISE - EXERCISE 14.4
23 Videos
- LINEAR EQUATIONS IN ONE VARIABLE BOOK - SWAN PUBLICATIONCHAPTER - LINEAR EQUATIONS IN ONE VARIABLE EXERCISE - EXERCISE 2.6
14 Videos
Similar Questions
Plot the following points on a graph sheet .Verify if they lie on a line.
A (4,0),B(4,2),C(4,6),D(4,2.5).
View SolutionDraw the graphs for the following tables of values , with suitable scales on the axes .
Cost of apples

View SolutionRefer to the graph given in fig.
How much petrol can be bought for Rs.600?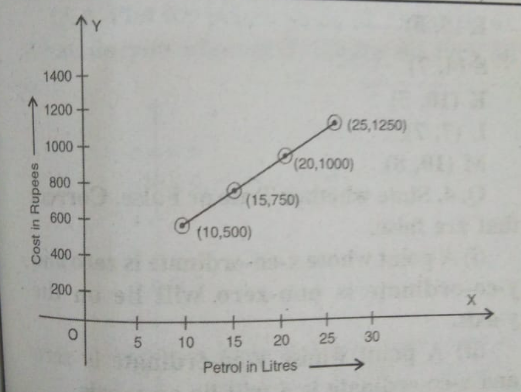
View SolutionFind and correct the errors in the following mathematical statement
4(x−5)=4x−5
View SolutionSolve the following equations. 8x−33x=2
View SolutionThe following graph shows the temperature forecast and the actual temperature for each day of a week.(a) On which days was the forecast temperature the same as the actual temperature? (b) What was the maximum forecast temperature during the week?(c) What was the minimum actual temperature during the week?(d) On which day did the actual temperature differ the most from the forecast temperature?
View SolutionMatch the following Column A to Column B

View SolutionThe inequation represented by the graph given below is :
View SolutionThe inequation that best describes the following graph is _________
View SolutionThe following graph shows the temperature forecast and the actual temperature for each day of a week.(a) On which days was the forecast temperature the same as the actual temperature? (b) What was the maximum forecast temperature during the week?(c) What was the minimum actual temperature during the week?(d) On which day did the actual temperature differ the most from the forecast temperature?
View SolutionThe following graph shows the temperature forecast and the actual temperature for each day of a week.
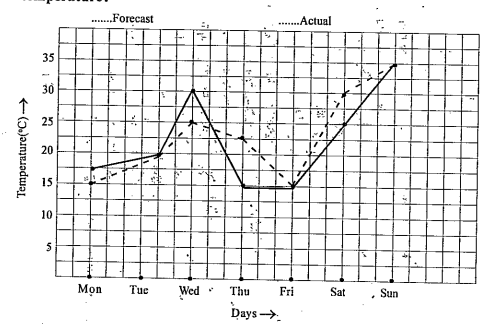
On which days was the forecast temperature the same as the actual temperature?
View SolutionThe following graph shows the temperature forecast and the actual temperature for each day of a week.
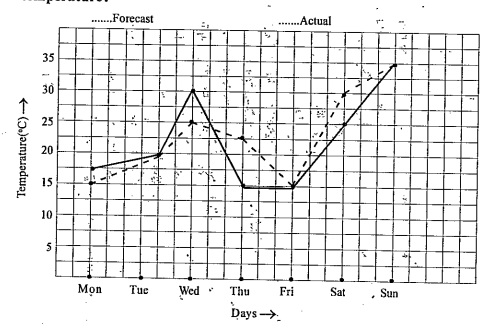
What was the maximum forecast temperature during the week?
View SolutionThe following graph shows the temperature forecast and the actual temperature for each day of a week.
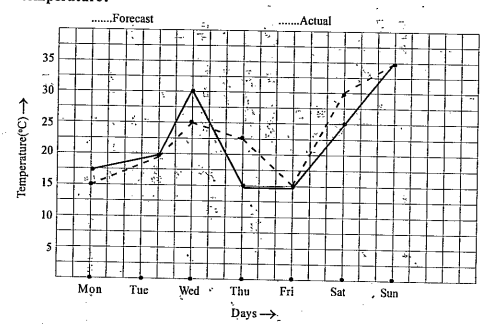
On which day did the actual temperature differ the most from the forecast temperature?
View SolutionThe graph below shows the forecast and actual temperature for each day of a week: Which day are the forecast temperature and the actual same?
View SolutionThe graph below shows the forecast and actual temperature for each day of a week: What was the maximum forecast temperature for the week?
View SolutionThe graph below shows the forecast and actual temperature for each day of a week: What was the minimum actual temperature for the week?
View Solution